Geisinger Health System National Health Policy Conference Creating a Health Care System
advertisement
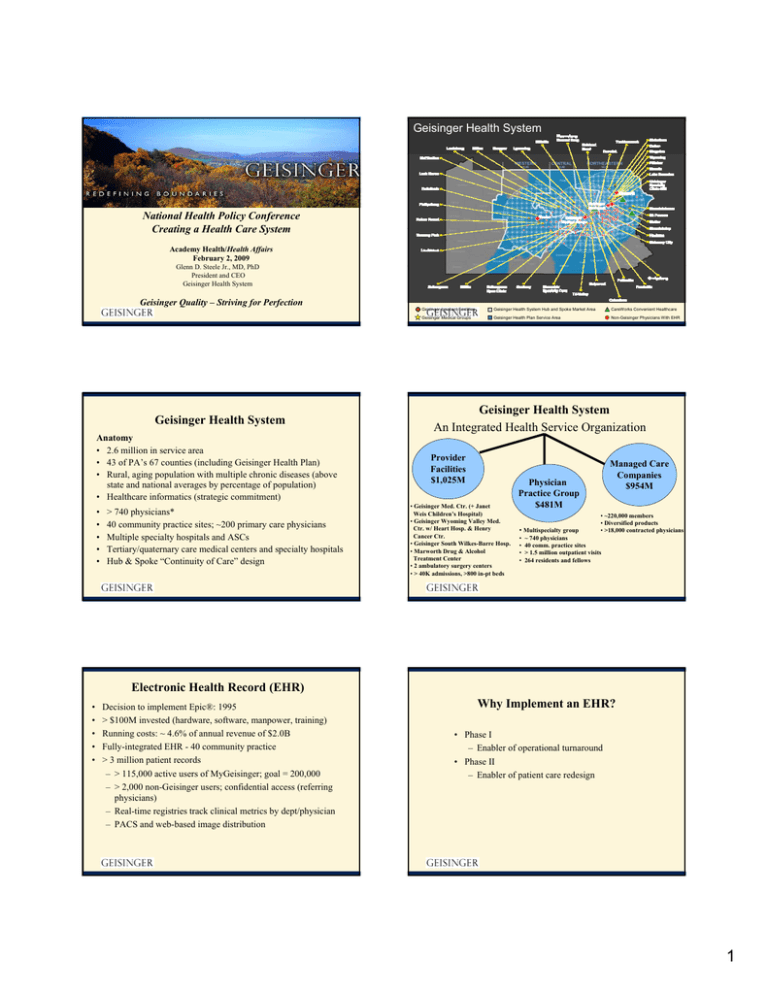
Geisinger Health System National Health Policy Conference Creating a Health Care System Academy Health/Health Affairs February 2, 2009 Glenn D. Steele Jr., MD, PhD President and CEO Geisinger Health System Geisinger Quality – Striving for Perfection Geisinger Health System Anatomy • 2.6 million in service area • 43 of PA’s 67 counties (including Geisinger Health Plan) • Rural, aging population with multiple chronic diseases (above state and national averages by percentage of population) • Healthcare informatics (strategic commitment) • • • • • > 740 physicians* 40 community practice sites; ~200 primary care physicians Multiple specialty hospitals and ASCs Tertiary/quaternary care medical centers and specialty hospitals Hub & Spoke “Continuity of Care” design Geisinger Inpatient Facilities Geisinger Health System Hub and Spoke Market Area CareWorks Convenient Healthcare Geisinger Medical Groups Geisinger Health Plan Service Area Non-Geisinger Physicians With EHR Geisinger Health System An Integrated Health Service Organization Provider Facilities $1,025M • Geisinger Med. Ctr. (+ Janet Weis Children’s Hospital) • Geisinger Wyoming Valley Med. Ctr. w/ Heart Hosp. & Henry Cancer Ctr. • Geisinger South Wilkes-Barre Hosp. • Marworth Drug & Alcohol Treatment Center • 2 ambulatory surgery centers • > 40K admissions, >800 in-pt beds Managed Care Companies $954M Physician Practice Group $481M • Multispecialty group • • • • • ~220,000 members • Diversified products • >18,000 contracted physicians ~ 740 physicians 40 comm. practice sites > 1.5 million outpatient visits 264 residents and fellows Electronic Health Record (EHR) • • • • • Decision to implement Epic®: 1995 > $100M invested (hardware, software, manpower, training) Running costs: ~ 4.6% of annual revenue of $2.0B Fully-integrated EHR - 40 community practice > 3 million patient records – > 115,000 active users of MyGeisinger; goal = 200,000 – > 2,000 non-Geisinger users; confidential access (referring physicians) – Real-time registries track clinical metrics by dept/physician – PACS and web-based image distribution Why Implement an EHR? • Phase I – Enabler of operational turnaround • Phase II – Enabler of patient care redesign 1 Targets for the Geisinger Transformation • Unjustified variation • Fragmentation of care-giving • Perverse payment incentives – Units of work – Outcome irrelevant • Patient as passive recipient of care, not active participant Geisinger Transformation Initiatives* • ProvenHealth Navigator (Advanced Medical Home) • ProvenCare® – Chronic Disease Care Optimization and Acute Episodic Care • Transitions of Care (TOC) • Patient Activation/Engagement *Achievable only through innovation ProvenHealth Navigator (Geisinger Advanced Medical Home) Proven Health Navigator (Advanced Medical Home) Partnership between primary care physicians (Geisinger and non-Geisinger) and GHP that provides 360-degree, 24/7 continuum of care • “Embedded” nurses • Assured easy phone access • Follow-up calls post-discharge and post-ED visit • Telephonic monitoring/case management • Group visits/educational services • Personalized tools (e.g., chronic disease report cards) Readmission Rate Empl P hase 2 Sites Phase - 1 Total Medical Cost Decreased 4% for Entire Population; ROI = 250% M edicare Co ntro l P o pulatio n 17.80% 16.80% 15.80% 14.80% 13.80% 12.80% 11.80% Jan-Apr 2007 Jan-Apr 2008 Readmission Rate Jan-Apr 2007 Jan-Apr 2008 Change Employed Phase 2 Medicare Control Population 17.0% 12.0% -5.0% 16.8% 17.6% 0.8% Trend -29.4% 4.8% 2 Chronic Disease Portfolio • • • • • ProvenCare® Chronic Disease Diabetes Congestive Heart Failure Coronary Artery Disease Hypertension Prevention Bundle Diabetes - Primary Care Bundle Summary >20,000 Patients Diabetes "Bundle" GHS Quality Targets Measures Standard Every 6 months 100% X < 7.0 X HgbA1C measurement HgbA1C control <7 LDL control Blood pressure control >9 100% X < 100 <130 >=130 < 130/80 < 140/90 >=140/90 < 100 < 130/80 X X Yearly 100% Yearly 100% Yearly 100% Yearly 100% Retinal exam Urine (protein) exam 7 to 9 Yearly LDL measurement Diab e tes " Bund le " 7 met CPSL FY07 Performance Criteria 8 met 9 (all) met 6/30/08 (12%) 3/31/08 (11%) X 12/31/07 (10%) GHS Q ual ti y Targets M easur es H gbA1C measur em ent H gbA1C contr ol LD Lm easurem ent LD Lcont rol B lood pressur econt r ol R etina exam l Foot exam U ir ne( pr otei n) exam Pneumococcal immunization Smoking status Ever y 6m ont hs 7 t o9 >9 Ye arly < 130 Ye arly >=130 Standard 100% < 7.0 100% < 100 100% CP SL FY 07 X X X X X X Ye arly 100% Ye arly O nce* 100% 100% X X X Non- smoker 100% U seof ACE/ ARB of r mi rc oalbum inur ia/ DM nephropat hy U seof ACE/ ARB of r hypert ension Y es Ye s 100% 100% Patie nts w horece v i e /achi eve ALL of the above Yearl y Sm oking stat us Influenza immunization Perf ormance Crit eri a <7 < 100 < 130/ 80 < 140/ 90 >= 140/ 90 < 130/ 80 Ye arly 100% Foot exam I nf luenza im muni az t ion Pneum ococcal im muni zatio n 100 % X Once* 100% X Non-smoker 100% X Use of ACE/ARB for microalbuminuria/DM nephropathy Yes 100% Use of ACE/ARB for hypertension Yes 100% Yearly 100% Patients who receive/achieve ALL of the above 9/30/07 (9%) X 6/30/07 (8%) 3/31/07 (7%) 12/31/06 (7%) 9/03/06 (4%) % Pts 0 Measures Met % Pts 1 Measure Met % Pts 2 Measures Met % Pts 3 Measures Met % Pts 4 Measures Met % Pts 5 Measures Met % Pts 6 Measures Met % Pts 7 Measures Met % Pts 8 Measures Met % Pts All Measures Met X Coronary Artery Disease Profile Report Primary Care Bundle Summary 7 met 8 met 9 (all) met 6/30/08 (20%) 4/30/08 (19%) 3/31/08 (19%) ProvenCare® for Acute Episodic Care (the “Warranty”) 12/31/07 (17%) 9/30/07 (16%) 6/30/07 (14%) 3/31/07 (11%) 12/31/06 (10%) 9/30/06 (8%) 3 ProvenCare® Portfolio Pay-for-Performance Acute Episodic Care • ProvenCare: – CABG – Angioplasty – Angioplasty + AMI – Hip replacement – Cataract – EPO – Perinatal – Bariatric surgery ProvenCare® • • • • • Identify high-volume DRGs Determine best practice techniques Deliver evidence-based care GHP pays global fee No additional payment for complications Quality ProvenCare® CABG: Reliability Clinical Outcomes - (18. mos) ProvenCare CABG % patients receiving all ProvenCare components 100% 90% 80% 70% 60% 50% 40% 30% 20% 10% 0% *Feb Q1 Q2 2006 Q3 Q4 Q1 Q2 2007 Q3 Q4 Q1 Q2 2008 Q3 In-hospital mortality Patients with any complication (STS) Patients with >1 complication Atrial fibrillation Neurologic complication Any pulmonary complication Blood products used Re-operation for bleeding Deep sternal wound infection Readmission within 30 days Before ProvenCare® (n=132) With ProvenCare® (n=181) 1.5 % 38 % 7.6 % 23 % 1.5 % 7% 23 % 3.8 % 0.8 % 6.9 % 0% 30 % 5.5 % 19 % 0.6 % 4% 18 % 1.7 % 0.6 % 3.8 % % Improvement/ (Reduction) 21 % 28 % 17 % 60 % 43 % 22 % 55 % 25 % 44 % Quarter *Single month of data Value • • • • Average total LOS fell 0.5 days (6.2 vs. 5.7) Hospital net revenue grew 7.8% Contribution margin of index hospitalization grew 16.9% 30-day readmission rate fell 44% ProvenCare Total Hip Replacement 100% 90% 80% 70% % patients 60% receiving all 50% ProvenCare 40% components 30% 20% 10% 0% Ma rA p 07 r M a -0 7 yJ u 07 n -0 Ju 7 lAu 07 g Se -07 pOc 07 tN o 07 v D e -07 cJa 0 7 n F e -0 8 bM a 08 rA p 08 r M a -0 8 yJ u 08 n -0 8 Financial Outcomes - (18 months) 4 ProvenCare Cataract ProvenCare PCI 100% 90% 80% % of patients receiving ALL ProvenCare components 70% % of patients receiving all components of ProvenCare 60% 50% 40% 30% Go Live 20% Oc t -0 No 7 v0 De 7 c07 Ja n0 Fe 8 b08 M ar -0 Ap 8 r-0 M 8 ay -0 Ju 8 n08 Ju l- 0 Au 8 g08 10% 100% 90% 80% 70% 60% 50% 40% 30% 20% 10% 0% M ar A p 07 r M -0 7 ay Ju 07 n0 Ju 7 lA u 07 gS e 07 pO 07 ctNo 0 7 v D e -0 7 cJ a 07 n F e - 08 bM 08 ar A p 08 r M -0 8 ay J u -0 8 n0 Ju 8 l-0 8 0% Not Just Surgery… Epo CKD (n=62) Control (n=74) Median days to goal = 47.5 days Median days to goal = 62.5 days % Time in goal = 69.8% % Time below goal = 13.7% % Time above goal = 16.5% % Time in goal = 43.9% % Time below goal = 39.7% % Time above goal = 16.4% Avg Epo Units/week = 6,698* Avg Epo Units/week = 12,000 Home/Clinic = 58.1%/41.9% Home/Clinic = 39.2%/60.8% Transitions of Care Expanded Dose Utilization = 40% Expanded Dose Utilization = 16% Avg Hgb at start = 9.6 mg/dl Avg Hgb at start = 10.0 mg/dl Avg T-Sat at start = 18% Avg T-Sat at start = 18% *Savings $3,860/pt/year @$0.014/unit of Epo (p<.001) Bucaloiu et. al, Managed Care Interface, June 2007. Preliminary First Quarter Results GWV Medicine Service 30 Day Readmission Rate Transitions of Care GMC Medicine Service 30 Day Readmission Rate 18.0% • Began January 2008 as joint quality/efficiency initiative that complements ProvenHealth Navigator (Advanced Medical Home) • Inpatient and outpatient interventions – Eliminate unnecessary admissions – Reduce readmissions • Free up capacity for more acutely-ill patients • To-date has focused on narrow patient populations (e.g., heart failure) • Program expansion is planned, including addressing LOS 18.0% 16.0% 16.0% 16.0% 17% 13.3% 14.0% 12.0% Reduction 14.0% 13.7% 22% 12.0% 10.0% 10.0% 8.0% 8.0% 6.0% 6.0% 4.0% 4.0% 2.0% 10.7% Reduction 2.0% 0.0% 0.0% Q1 Q1 Q1 Q1 FY2008 FY2009 FY2008 FY2009 5 Lessons for National Reform • Innovation best practices can be adopted (and adapted) within a system • Restructure payment systems to better reward primary care physicians and encourage entry into this field • Encourage payors to invest in case managers embedded in primary care practices (re-engineer primary care) – Offset costs with decreased admissions and readmissions • Tie bundled payment to quality and cost efficiency outcome metrics Lessons for National Reform (cont’d) • Specialists should be attracted to centers of excellence. A “hub and spoke” design with centrally located state-of-theart care and primary care providers living close to their patients can be connected to specialists by shared EHRs and broadband-enabled telemedicine • Electronic health records are vital to patient quality, assessment of care given, and innovation • Telemedicine and scope of practice solutions can address shortage of physicians, particularly in rural areas • The Medical Home model should be adapted and expanded with incentives that reward quality, efficiency, and decrease unnecessary admissions and readmissions 6

