Phys847/492 Problem Set #2 Due: Oct. 30 in class 1. Network Properties
advertisement
Phys847/492
Problem Set #2
Due: Oct. 30 in class
1. Network Properties
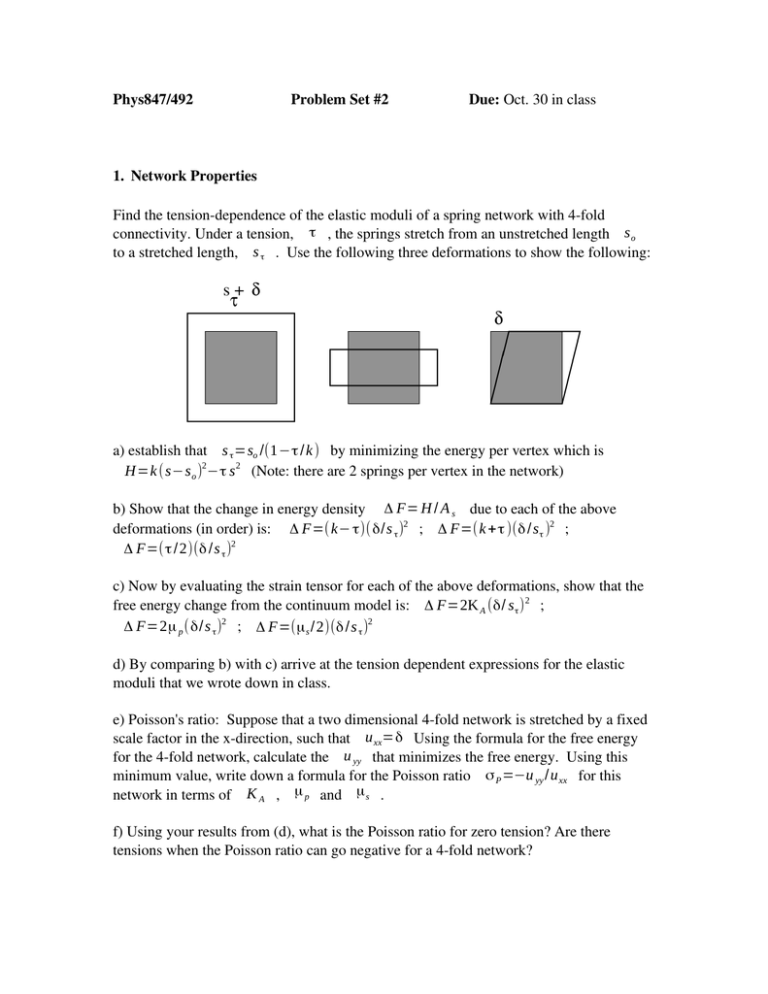
Find the tension­dependence of the elastic moduli of a spring network with 4­fold connectivity. Under a tension, τ , the springs stretch from an unstretched length s o
to a stretched length, s τ . Use the following three deformations to show the following:
a) establish that s τ =so /(1−τ / k ) by minimizing the energy per vertex which is H=k (s−s o )2−τ s 2 (Note: there are 2 springs per vertex in the network)
b) Show that the change in energy density Δ F= H / A s due to each of the above deformations (in order) is: Δ F=( k− τ)( δ/s τ )2 ; Δ F=(k + τ )(δ /s τ )2 ; Δ F=(τ / 2)(δ /s τ )2
c) Now by evaluating the strain tensor for each of the above deformations, show that the free energy change from the continuum model is: Δ F=2K A (δ/ s τ ) 2 ; Δ F=2μ p (δ/s τ )2 ; Δ F=(μ s /2)(δ / s τ )2
d) By comparing b) with c) arrive at the tension dependent expressions for the elastic moduli that we wrote down in class.
e) Poisson's ratio: Suppose that a two dimensional 4­fold network is stretched by a fixed scale factor in the x­direction, such that u xx=δ Using the formula for the free energy for the 4­fold network, calculate the u yy that minimizes the free energy. Using this minimum value, write down a formula for the Poisson ratio σ P =−u yy /u xx for this network in terms of K A , μ p and μ s .
f) Using your results from (d), what is the Poisson ratio for zero tension? Are there tensions when the Poisson ratio can go negative for a 4­fold network?
2. Monte carlo simulation of molecular motor
In this problem you will carry out a simulation of the molecular motor presented in class. Assume the motor diffuses in a periodic potential given by V0
x
x< α b
α
b
V (x )=
.
−V o
(x−b) x >α b
b−α b
Every so often the potential switches and becomes flat, such that V (x )=0 . Start with a walker at x = 0, and at each time step have it take a random move either to the left or to the right, with a magnitude δ . The Metropolis Monte carlo algorithm then has you evaluate the energy of the particle before and after the step. If the energy went down or stays the same, always accept the move. If the energy goes up, accept the move if a drawn uniform random number is less than exp (−Δ E) where Δ E=E f −E i >0 . If the potential is off for N time steps, the typical distance the particle travels is ⟨ x 2 ⟩=N δ2 and is related to the width parameter, w, in the class notes. In the analytical model, α and w/b were the important parameters. Here you have the parameters α , √ (N )δ /b and the potential height V o .
{
}
In a given simulation, keep track of the x positions of M random walkers (let M ~ 1000 for good stats). Let the potential be in the ON or the OFF state for N time steps (i.e. let the time spent in each be the same – you can try playing with this if you want). Start with all of them at x=0. Plot the histograms of their positions as a function of the total number of time steps (i.e. T = 2 N, 4 N, 6 N etc). How would you estimate the net motion from this data?
You should keep parameter b fixed and have δ fixed at some small number like 0.05 b. Then choose values for N, α and V o and plot the histograms of the distribution of motor positions, x at increasing values of the simulation time T.
Are your distributions consistent with the results from the simple analytical model?
3. Output from a promoter:
In this problem you will derive the rate of mRNA production from a promoter using equilibrium thermodynamics principles. The amount of mRNA produced for a given gene is proportional to the probability of the RNA polymerase (RNAP) binding to its promoter. The RNAP can be aided in binding to its binding site via the action of transcription factors which bind to other binding sites in the promoter. The promoter can thus exist in a variety of bound and unbound states for all the various binding configurations of RNAP and transcription factors. The probability of the promoter being bound by RNAP is simply the ratio of the concentrations of RNAP bound states to the total concentration of all promoter states. (a) Consider case (i), where RNAP at concentration [P ] simply binds and unbinds to its binding site on a given promoter sequence. The amount of free unbound sequence is [D ] and the amount of RNAP bound promoter is [DP ] . At equilibrium, the ratio [D ][P ]/ [ DP ]=K P with K P being the dissociation constant for this reaction in units of concentration. The probability of RNAP bound promoter is given by p bound =[DP ]/ Dtot , where Dtot =[ D][ DP ] . Show that p bound =P / K P P (I've dropped the concentration notation of “[ ]”).
(b)Consider now the case where in addition to the binding site for RNAP, there is also a binding site for a transcription factor at concentration [ A] . Now the three other reactions are also occurring. The dissociation constants are given by: [DA][ P ]/[ DAP ]=K AP , [D ][ A]/[ DA]=K A , and [DP ][ A]/[ DAP ]=K PA . Find two different expressions in terms of the dissociation constants for the ratio [D ][ A][P ]/ [DAP ] considering the two different available pathways. Are all the dissociation constants independent? (This is detailed balance.)
(c) For case (b) the probability of RNAP binding is given by p bound =[ DP ][DAP ]/ [ D][ DA][ DP ][ DAP ] . Show that this is
p bound =
P / K P K P / K AP A/ K A P / K P
1P /K P A/ K A K P / K AP A/ K A P / K P
(d)The ratio of dissociation constants f = K P / K AP gives the effect of enhancement on the probability of RNAP binding due to the presence of the transcription factor. For f 1 the transcription factor enhances transcription. For the case f =1 show that the result in (c) reduces down to what you found in (a). This makes sense since the binding of “A” has no effect on the binding of RNAP in this case.
(e)The rate of production of mRNA is given by r = p bound where is the maximal rate of expression. In most treatments of biological networks, we never explicitly keep track of the RNAP concentration as it is assumed to be constant. If P is constant, using the results from (c), show that the mRNA production rate can be written solely in terms of the concentration of the v 0 v A A/K eff
A
transcription factor as r =
where 0 is the rate when A=0, eff
1 A/ K A
A is the rate when A∞ and K eff
is an effective dissociation constant A
for the transcription factor. Give 0 , A and K eff
in terms of the A
constants P , K P , K A , f , .
(f) Sketch r for the cases f 1 and f 1 . For which case is A an 'activator' or 'repressor'?
4. λ­repressor: the cI promoter and cooperativity: In class we saw that the cI promoter has two binding sites for CI, and that they interact cooperatively. The production of cI mRNA depends on the probability of these sites being occupied. The concentration of CI protein is [ X ] . We consider the binding of X to its two binding sites, which has a scheme almost identical to problem 1, but with different dissociation constants.
(a)Show that if K 1 ≫ K 2 and K 3 ≫ K 4 that the fractions of singly bound DNA, [DX1 ]/[ D][ DX1][DX2 ][ DX1X2] and a similar fraction for
[DX2 ] are negligible.
(b) With the limits given in (a), the probability of being bound is approximately p bound ≈[DX1X2 ]/[ D][ DX1X2] . Show that in this case we arrive at the familiar Hill function, p bound =X 2 /K 1 K 2 X 2 . (This is the Hill function with n=2, and thus is an approximation which relies on the assumption that the binding of the second site is greatly increased by binding to the first.)
(c)We're now ready to study the dynamics. The production of CI will occur at some low rate v 0 when there is no CI bound and at a rate v 1 when CI is bound. It is also degraded by dilution and active degradation effects at a rate . Thus the dynamics of CI production is as we wrote in class:
2
dX v 0v 1 X / K1 K2
=
− X
dt
1X 2 /K1 K2
At steady state, dX / dt =0 . Just like in class, plot various possible fixed point solutions by looking at the intersection of the two functions of X. We are free to de­dimensionalize time and concentration so set =1 and K 1 K 2 =1 . Plug in different values of v 0 and v 1 and plot all the possible scenarios for intersection leading to either monostable or bistable behaviour.
(d)Write the fixed point equation as a cubic in X . At the boundary between monostability and bistability, two of the roots collide and thus there are only two fixed points. For a cubic equation that has two equal roots, we can generally write it as 3
2
2X
3
X −a X −a X − a =X −2 a X 12 a − a
where is the ratio of the two different roots. Compare your cubic to the general form and come up with two parametric equations in terms of for the parameters v 0 and v 1 . Using these conditions, make a parametric plot in the {v 0 , v1 } plane, highlighting the regions of monostability and bistability. (These regions had better agree with the parameters you tested in (c)).
