II. MICROWAVE GASEOUS DISCHARGES
II. MICROWAVE GASEOUS DISCHARGES
Prof. S. C. Brown
Prof. W. P. Allis
Dr. K. S. W. Champion
Helen R. Land
J. J. McCarthy
G. J. Schulz
A. B. St. Maurice
A. HIGH-DENSITY MICROWAVE GASEOUS DISCHARGES
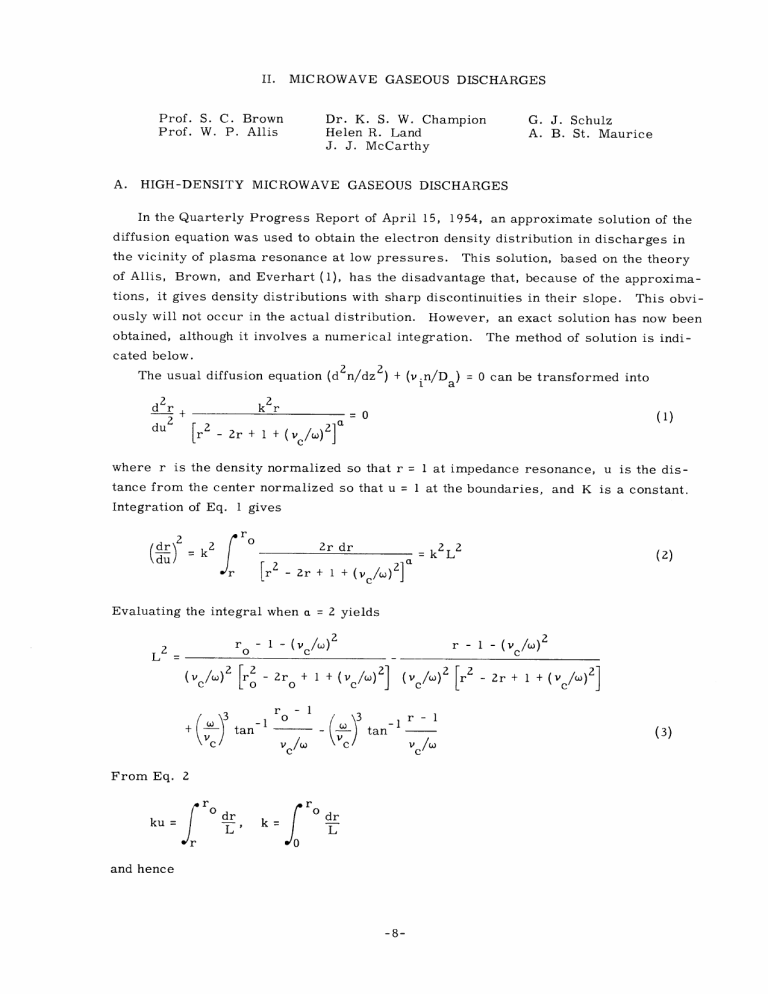
In the Quarterly Progress Report of April 15, 1954, an approximate solution of the diffusion equation was used to obtain the electron density distribution in discharges in the vicinity of plasma resonance at low pressures. This solution, based on the theory of Allis, Brown, and Everhart (1), has the disadvantage that, because of the approximations, it gives density distributions with sharp discontinuities in their slope. This obviously will not occur in the actual distribution. However, an exact solution has now been obtained, although it involves a numerical integration. The method of solution is indicated below.
The usual diffusion equation (d2n/dz 2 )
+ (vin/D) = 0 can be transformed into
2 dr+ du2 r
2
2 kr
- 2r + 1 + (vC/w)
2
=0 (1) where r is the density normalized so that r = 1 at impedance resonance, u is the distance from the center normalized so that u = 1 at the boundaries, and K is a constant.
Integration of Eq. 1 gives r dr2 k
2 o r r-
2r dr
2r + 1 + (c
)2 ]
= k2L 2
Evaluating the integral when a = 2 yields
2
L2 r -1 - (vc) 2 r - 1 -(/W ) 2
Sr
+
2
MI/) [r 2 r -1
-2r
+ 1 + (v/w)
-2r
+ 1 + (v/w)2]
0
Vc/ tan r-1
V
From Eq. 2 ku= r
0 dr k
L' or
0 dr
L and hence
(3)
-8-
(II. MICROWAVE GASEOUS DISCHARGES) u = r r dr/L or dr/L
(4) which gives r as an implicit function of u. The two integrals must be evaluated numerically with values of 1/L calculated from Eq. 3. Simpson's rule can be used for the greater part of the region. However, the integrand in both integrals becomes infinite when r tends to r .
Near r , L
2 is very nearly linear. Actually L
2
C (r r) and hence (l/L) cc (r r)- .
Thus a formula can be used (2) which approximates the value of the integral of functions which behave like x-1/2
In Fig. II-1, the electron density distributions obtained by the method given above are compared with those given in reference (1) for vc/W = 0.4. As might be expected, the approximate solution deviates most in the vicinity of the discontinuities in the slopes of the curves. When Vc/w = 0 it is not feasible to obtain an exact solution due to singularities. However, curves have been calculated for v c/ = 10 and these will not be substantially different. These curves are plotted in Fig. II-2 and it can be seen that, within the plotting accuracy, the curve for r
0
= 1 is a rectangle.
The impedance at any point in a microwave discharge when v c is independent of the electron energy is
[1 + (v )]
(5)
T
We"o
2
[(r-1)2 + (vc/w)2]
1/2 n
Thus p/k can be plotted as a function of r( c: n
2 ) and v /w(cC pX). The resulting surface is sketched in Fig. 11-3. It can readily be seen that for pX < 50 the peak at impedance resonance is large and can be used to determine the position of resonance and hence the electron density in the plasma. However, for larger pX the maximum is little greater than the nearby values and this method is not accurate. In this region the conditions for the reactance to be zero can be observed and hence from the relation for dielectric resonance the electron density calculated.
Several experimenters have investigated plasma resonance effects on the transmission of electromagnetic waves through a dc discharge. The impedance curves of the plasma as a function of electron density obtained by Goldstein and Cohen (3) and Makinson et al. (4) reproduce the shape of appropriate sections of the surface in Fig. 1I-3. Makinson also obtained reasonable agreement with the position of impedance resonance and the value calculated from the electron density found by a Langmuir probe.
-9-
O u
Fig. II-1
Electron density as a function of position for a = 2 and v /W = 0. 4 with several values of r .
For each r
0 there is a full curve giving the accurate distribution and a dotted curve giving the distribution obtained from the approximate solution.
Fig. II-2
Electron density as a function of position for a = 2 and v / c
= 10
3 with several values of r o
-10-
(II. MICROWAVE GASEOUS DISCHARGES) pA
Fig. II-3
p/X (impedance/wavelength) as a function of nX
2 and pX for hydrogen, where n is the density per cm 3, X is the wavelength in centimeters, and p is the pressure in mm Hg.
S. Buchsbaum of this Laboratory has now performed the corresponding experiment with a microwave discharge. His data, although preliminary, seem to indicate that the impedance curves of the microwave plasma have the general form predicted by theory. The position of impedance resonance agrees fairly closely with the theoretical value calculated from the electron density determined with a double probe. This means that another method is now available for the measurement of electron density in a microwave discharge.
K. S. W. Champion
References
1. W. P. Allis, S. C. Brown, and E. Everhart, Phys. Rev. 84, 519 (1951).
2. Jeffreys and Jeffreys, Methods of Mathematical Physics (Cambridge, 1946) p. 265.
3. L. Goldstein and N. L. Cohen, Elec. Commun. 28, No. 4, 305 (1951).
4. R. E. B. Makinson et al., Proc. Phys. Soc. B64, 665 (1951).
B. MICROWAVE BREAKDOWN IN HYDROGEN AT HIGH PRESSURES
This experiment has been unavoidably interrupted. In the meantime, work is being done in preparation for extending the range of measurements by means of pulse techniques. It is hoped that these pulse data can be correlated to the existing continuous
-11-
(II. MICROWAVE GASEOUS DISCHARGES) wave data in such a way that the equivalent continuous wave breakdown field can be calculated.
J. J. McCarthy
C. PLASMA OSCILLATIONS
A spherical tube, similar to that previously used by Looney (1), has been completed to further studies on the nature of plasma oscillations in a dc mercury discharge.
Two major additions were incorporated into the design of the main discharge region.
The anode and its sheath-controlling electrode were mounted on a movable press, permitting a variable plasma interaction region. Also, the anode and cathode sheath
(controlling) electrodes were electrically separated, allowing the variation of either sheath independently of the other.
On completion of the necessary circuitry, investigation of the effect of the new param eters on the standing-wave patterns of the oscillations will begin.
This will include experimentation in the sheath and interaction regions.
A. B. St. Maurice
References
1. D. H. Looney and S. C. Brown, Phys. Rev. 93, 965 (1954).
D. HYPERFINE STRUCTURE IN POSITRONIUM
Positronium, the hydrogen-like structure composed of a positron and an electron, is the only observable bound system composed entirely of Dirac particles. It is thus the only bound system in which a discrepancy between experiment and theory would indicate the possible need for an extension of the laws of electrodynamics as they are now given by the Dirac equation with radiative corrections. Since the ground-state fine-structure splitting of positronium is sensitive to high order radiative corrections, the measurement of that splitting, AW, is a good check on the theory. It has been measured indirectly because the direct measurement would require several hundred watts of microwave power in the millimeter region. Such power is, as yet, unavailable.
The indirect measurement is accomplished by mixing the 1S
0 state with the 3Sl (m = 0) state in a magnetic field. (See Fig. 11-4.) With about 10 percent mixing (requiring a field of approximately 9000 gauss) the Sl (m = 0) state decays almost completely by twoquantum annihilation, the lifetime being approximately 10
-8 sec. The annihilation occurs because of the particle-antiparticle nature of the constituents of the atom.
The 3Sl (m = +1) states are unperturbed by the magnetic field and decay almost entirely by three-quantum annihilation in approximately 10 - 7 sec. Transitions can be
-12-
(II. MICROWAVE GASEOUS DISCHARGES)
AEz
M-'*
.5 I 1.5
Kilogauss
2 2.5
II
M.O
8834.5GAUSS
e= ERROR
8898.0 GAUSS 8961.5
Fig. II-5
Resonance in argon at 1 atmosphere: rf power=
140 watts; rf frequency = 3013.25 Mc/sec.
Solid curve is resonance with y = 4. 3 x 10
- 3
H.
Fig. II-4
Zeeman splitting of ground state of positronium:
AW = field free splitting;
AE = microwave energy used.
accomplished from the
3
Si (m = +1) to the 3S
1
(m = 0) state by microwave energies in the 10-cm region. These transitions can be detected by a change in the ratio of two- to three-quantum annihilation. Then, measurement of the field and microwave frequency provides a measure of AW by the Breit-Rabi formula (1).
This measurement was first made by Deutsch and Brown (2) in 1951. At that time the measurement of AW yielded
AW = 203, 500 ± 300 Mc/sec
In the present experiment the error has been cut by a factor of 10 mainly by an increase in the rf power available and an improvement in the stability of the source.
In the earlier experiment, a QK61 magnetron was used, and the resulting fraction,
4, of the m = +1 states which was quenched was about 2 percent. The statistical uncertainty in the two- and three-quantum decay rates almost entirely masked the resonance
-13-
(II. MICROWAVE GASEOUS DISCHARGES) effect. In the present experiment a 1-kw, tunable, cw magnetron was used to increase
4 to 15 percent. The experiment was done in silver-plated cavities operating in the
TM1, i, 0 mode. The Q of these cavities was about 20, 000 and, with 200 watts of rf power, rf magnetic fields of approximately 10 gauss were obtained.
This greatly increased the ratio of the resonance magnitude to the statistical fluctuations, and hence greatly improved the accuracy.
The best value obtained for the fine-structure splitting was
AW = 203, 375 + 30 Mc/sec
The best available theoretical value of AW has been calculated by Karplus and Klein to be
AW = 203, 370 Mc/sec
Klein estimates that corrections resulting from the next order of approximation are probably less than 60 Mc/sec.
The experiment was done in several gases, at several pressures, and at two values of the magnetic field. Within the experimental error none of these parameters affect
AW.
The experiment also provided an excellent opportunity to check the theory of line shape, since this is one of the few cases in which the natural linebreadth is large compared to Doppler broadening. Within the experimental error the line shape, resonance magnitude, and linewidth agree well with the theory.
Figure II-5 is a summary of about 12 hours of data in argon. This represents approximately 10 percent of all the data taken. The solid curve represents the theoretical curve shape. The indicated vertical errors are the result of statistical fluctuations in the counting rate and do not include allowance for equipment drift. Such drifts almost double the vertical errors.
R. Weinstein
References
1. G. Breit and I. I. Rabi, Phys. Rev. 38, 2082 (1931).
2. M. Deutsch and S. C. Brown, Phys. Rev. 85, 1047 (1952); also Quarterly Progress
Report, Research Laboratory of Electronics, M. I. T., Oct. 15, 1952, pp. 8, 9.
-14-
