I. SOFT X-RAY SPECTROSCOPY
advertisement
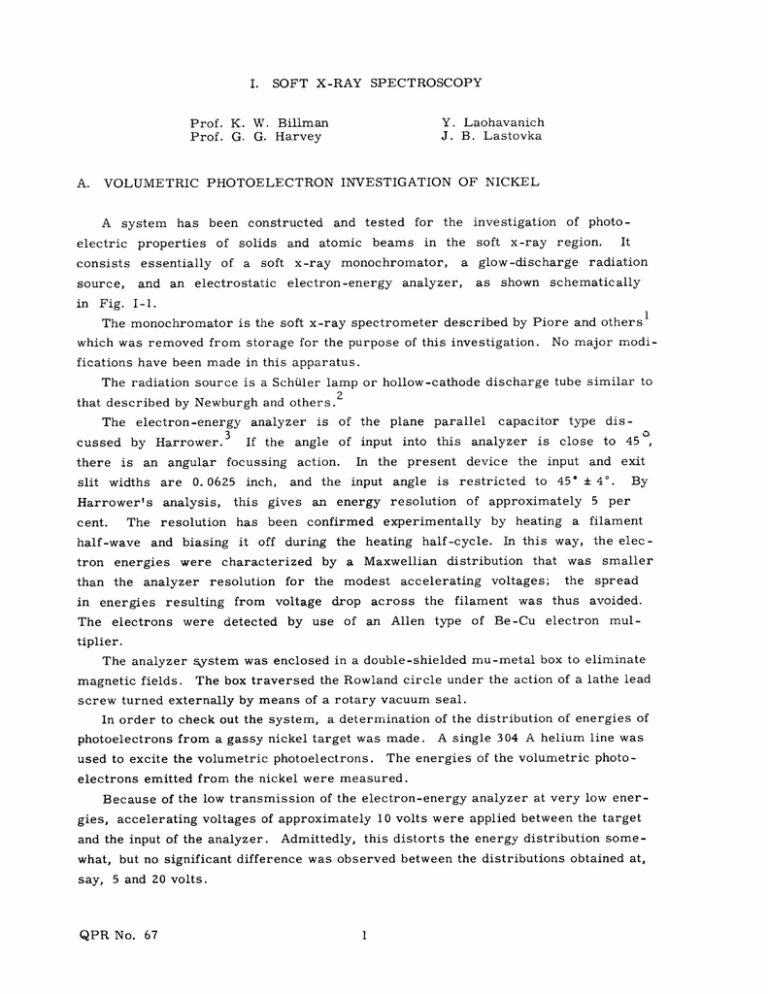
SOFT X-RAY SPECTROSCOPY I. Y. Laohavanich J. B. Lastovka Prof. K. W. Billman Prof. G. G. Harvey VOLUMETRIC PHOTOELECTRON INVESTIGATION OF NICKEL A. A system has in an and source, of a soft essentially consists and of solids properties electric beams atomic a monochromator, x-ray analyzer, electron-energy electrostatic the in of photo- investigation for the and tested been constructed It region. x-ray soft glow-discharge radiation schematically as shown Fig. I-i. 1 The monochromator is the soft x-ray spectrometer described by Piore and others No major modi- which was removed from storage for the purpose of this investigation. fications have been made in this apparatus. The radiation source is a Schiller lamp or hollow-cathode discharge tube similar to that described by Newburgh and others. 2 electron-energy analyzer is 3 If the angle cussed by Harrower.3 of the plane The there is are widths slit Harrower's The cent. half-wave tron in The this resolution has and biasing and the gives an off were energy resolution during the from detected by a heating the input and exit to 45* ± 4o. a In this way, accelerating voltages; filament Allen type was of Be-Cu the thus By 5 per filament the elec - distribution that was across the by use of an o to 45 , close of approximately half-cycle. Maxwellian drop is experimentally by heating for the modest voltage analyzer restricted angle is input type dis- capacitor device present In the been confirmed resolution resulting electrons it of input into this action. characterized were analyzer energies inch, 0. 0625 analysis, energies than the focussing an angular parallel smaller spread avoided. electron mul- tiplier. The analyzer system was enclosed in a double-shielded mu-metal box to eliminate magnetic fields. The box traversed the Rowland circle under the action of a lathe lead screw turned externally by means of a rotary vacuum seal. In order to check out the system, a determination of the distribution of energies of photoelectrons from a gassy nickel target was made. used to excite the volumetric photoelectrons. A single 304 A helium line was The energies of the volumetric photo- electrons emitted from the nickel were measured. Because of the low transmission of the electron-energy analyzer at very low energies, accelerating voltages of approximately 10 volts were applied between the target and the input of the analyzer. Admittedly, this distorts the energy distribution some- what, but no significant difference was observed between the distributions obtained at, say, 5 and 20 volts. QPR No. 67 (I. SOFT X-RAY SPECTROSCOPY) ELECTRON ENERGY ELECTRON MULTIPLIER TO DIFFUSION . PUMP DOVE - TAIL TO MECHANICAL PUMP TRACK KOVAR ANODE HOLLOW GRAPHITE CATHODE Fig. I-1. Photoelectron spectrometer mounted inside the soft x-ray spectrometer. A typical photoelectron energy distribution is shown in Fig. I-2. The important features are that, despite a photon energy of 44. 4 ev, the peak of the photoelectron energy distribution is at -2 ev, that is, at a total energy after acceleration of 11. 2 ev, and that no electrons are detected which have energies greater than -10 ev above the noise. All such distributions, of which 19 were taken, have a sharp edge on the low-energy 30 304A RADIATI ON Z B9.2V APPLIED, ACCELERATING VOLTAGE 2 O/o PROBABL E ERROR t 20 z 10 0 I L. 8.0 I 9.0 10.0 i 11.0 I 12.0 I 13.0 I 14.0 I 15.0 I 16.0 ELECTRON ENERGY (e v ) Fig. 1-2. QPR No. 67 Photoelectron energy spectrum of nickel photocathode. I I 17.0 Il l I 18.0 19.0 (I. side, presumably at zero initial electron energy. SOFT X-RAY SPECTROSCOPY) This edge was used to calibrate the analyzer and evaluate the effect of contact potential that was, incidentally, zero within ±0. 1 ev. The only previous measurements of extreme ultraviolet photoelectron energy dis4,5 tribution from nickel were made with a planar geometry, stopping-potential apparatus. Such a device, the kine- at best, only gives the "normal" energy distribution, that is, tic enegry associated with motion normal to the surface. Furthermore, these measure- ments were made with an electron multiplier placed behind a coarse retarding grid. This obviously allows field distortion between the grid wires, causing a parabolic potential distribution that may dip as much as 25 volts, although the report does not give sufficient data on which to base a precise calculation. In any event, it is not surprising that they get identical photoelectron distributions with nickel and tungsten. However, their results do agree with ours in that they get very few electrons above 5 ev. PLASMA LOSS, 19.5 ev PLASMA LOSS, 19.5 ev REMAINING ENERGY, - lev hv= 44.4 ev WORK FUNCTION,- 4.5 ev FERMI LEVEL OF VALENCE SWIDTH 5.0 ev BAND, HIGHEST DISCRETE LEVEL, 66 ev BELOW -, M FERMI LEVEL Fig. 1-3. Level diagram of nickel (not drawn to scale). The observed results can be explained on the basis of "collective" electron-electron The width of the interactions, which give rise to the "plasma" oscillations in metals. valence band in nickel is 5. 0 ev and the work function is approximately 4.5 ev. (See 6 Fig. 1-3.) From the energy of the M2,3 absorption edge, it is seen that the 3p levels are approximately 66 ev below the Fermi level. QPR No. 67 Thus, all photoemission from the (I. SOFT X-RAY SPECTROSCOPY) 304 A (44.4 ev) photons must come from the valence band. The mean-free path for excitation of plasma oscillations is considerably shorter than the photon penetration depth. Thus, a photoelectron has many opportunities to excite plasma oscillations on its way out of the metal. Robins and Swan 7 list the char- acteristic electron-energy losses of interest to the present discussion as occurring at 4.3, 8.3, and 19.5 ev. These are due to M4, 5 shell ionization, a lowered plasma loss, and a normal plasma loss, respectively. The lowered plasma loss is an effect of the fact that the specimen boundary permits another mode of oscillation distinct from the normal mode. Of course, this is very sen- sitive to surface conditions and contamination and hence cannot be discussed intelligently in the present case, since very little target preparation was attempted. such preparation would have greatly reduced the quantum yield. Indeed, 4 It is seen that an electron liberated from the Fermi level by a 304 A photon and escaping the surface after exciting two normal plasma oscillations will have approximately 1 ev of energy remaining. This is in good accord with the peak of the distri- butions observed here, and hence that mechanism is postulated as being primarily responsible for the low-energy photoelectron distribution observed. H. H. Barrett, K. W. Billman References 1. E. R. Piore, G. Instr. 23, 8 (1952). G. Harvey, E. M. Gyorgy, and R. 2. R. Newburgh, L. Heroux, and H. E. Hinteregger, the extreme ultraviolet (to be published in Appl. Opt.). 3. G. A. Harrower, Rev. Sci. Instr. 26, 4. H. E. Hinteregger and K. Watanabe, H. Kingston, Rev. Sci. Two light sources for use in 850-854 (1955). J. Opt. Soc. Am. 43, 604 (1953). 5. L. Heroux and H. E. Hinteregger, Photoelectron energy distribution measurements for 10 to 50 ev photons with a planar analyzer and electron multiplier (to be published in Appl. Opt.). 6. D. H. Tomboulian, Handbuch der Physik, Vol. 1957), pp. 243-304. 7. J. L. Robins and J. QPR No. 67 30 (Springer B. Swan, Proc. Phys. Soc. (London) 16, Verlag, Berlin, 857 (1960).
