Document 11015322
advertisement
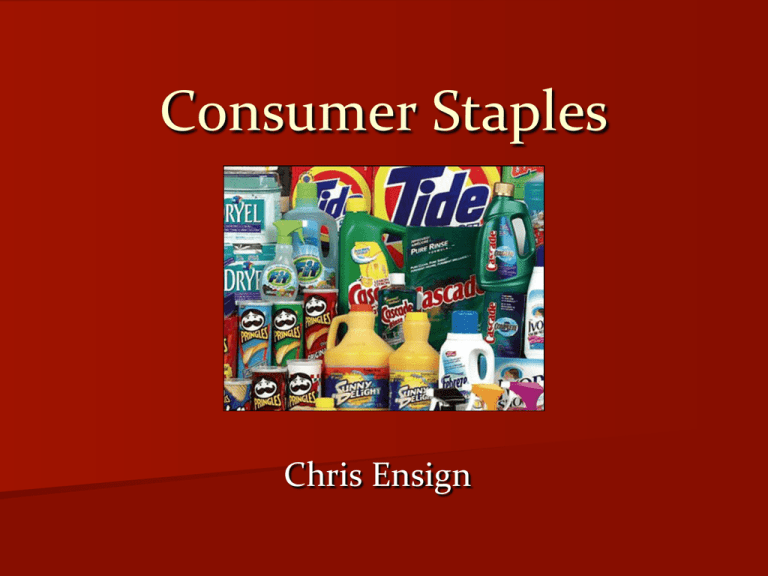
Consumer Staples Chris Ensign Sector Overview Sector Overview Sector weight for S&P Consumer Staples: 9.27% Con Discret Con Staples Energy Financials Health Care Industrials IT Materials Telecom Utilities Sector weight of SIM Consumer Staples: 9.16% Con Discret Con Staples Energy Financials Health Care Industrials IT Materials Telecom Utilities Industry Overview Key Players Performance YTD: 0.22% QTD: -­‐0.50% Business Analysis Demand and Life Cycle n Non-­‐Cyclical / Defensive n Demand remains constant through good and bad economies n Consumers are unwilling or unable to cut consumer staple products from shopping n Part of routine buying Demand and Life Cycle n Predictable demand is easy for suppliers / producers to keep up with n Large field diversified industries offers many investment choices n Low Beta and steady dividends offer protection to portfolio Market Timing / Life Cycle n n Mature products offer little growth opportunities Growth is often expansion in to new geographic territories or consolidation Competitive Analysis Threat of New Entrants Low • Brand recognition is extremely important • Must achieve large economies of scales • Significant incumbent advantages Power of Suppliers Low Power of Buyers High • Many suppliers compete for few large players • Suppliers are generally more commodity based • Little to no switching costs • Buyers have many choices and frequent buying opportunities Intensity of Rivalry High Threat of Substitutes Low • Little differentiation leads to price wars • Insignificant innovation • Established products and brands are ingrained in culture and lifestyle Economic Analysis Correlation to S&P Driving Factors n Consumer Price Index Consumer Confidence Unemployment Commodity Prices Dollar Value n Little relative exposure because of nature of products n n n n Financial Analysis EPS versus S&P n Lower but more consistent Profit Margin versus S&P n Lower but more consistent Revenue per Share versus S&P n Lower but more consistent Consumer Staple Data Valuation Analysis Absolute Data n Sector is expensive relative to history High Low Median Current P/E 21.0575 11.4025 17.3768 20.3595 P/B 5.6351 2.7453 3.9841 5.6277 P/S 1.3674 0.6876 1.0627 1.3656 P/EBITDA 12.4163 6.0567 9.2320 12.2976 Relative to S&P n Sector is similar to historical averages High Low Median Current P/E 1.2644 0.5872 1.0671 1.0819 P/B 1.9670 1.3332 1.6532 1.9293 P/S 1.0643 0.6943 0.7918 0.7247 P/EBITDA 1.6421 0.9784 1.2801 1.1982 Industry Comparison 1 Month 3 Month YTD P/E P/S Dividend Yield Consumer Staples -­‐1.25 -­‐0.50 0.22 25.29 1.35 2.72 Household & -­‐0.86 Personal Products -­‐3.63 -­‐8.05 24.33 2.77 2.90 Food, Beverage & Tobacco -­‐1.47 3.26 3.48 30.10 2.24 2.90 Food & Staples Retailing -­‐1.06 -­‐5.67 0.35 19.40 0.60 2.18 Recommendation Underweight n Current P/E’s are expensive compared to historical averages n No significant growth opportunities n Consumer Staples creates important relative stability to portfolio Industry Recommendations n Overweight Food & Staples Retailing – Better value with lower P/E n Underweight Food & Beverage and Household & Personal Products – Higher P/E’s are too expensive for sector – Strong USD is not attractive for exporting
