Notes 1813
advertisement
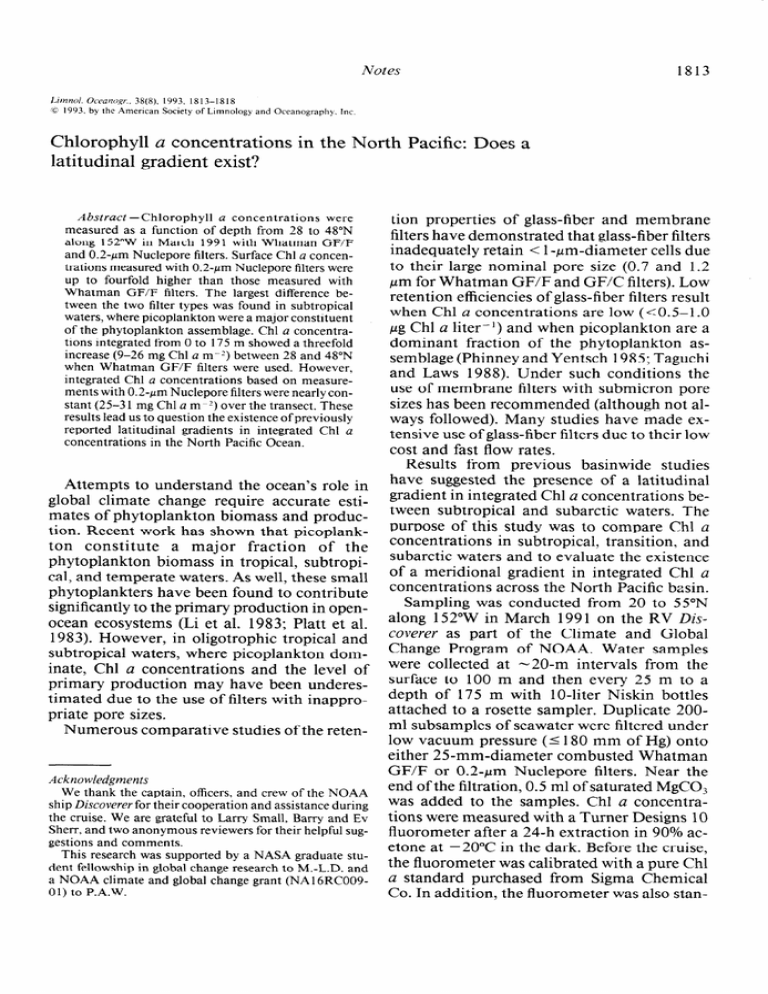
Notes Limnol. Oceatzogr., 38(8). 1993, 1813-1818 (0 1993, by the Ameruzan Society of Limnology and Oceanography. 1813 Inc Chlorophyll a concentrations in the North Pacific: Does a latitudinal gradient exist? Abstract -Chlorophyll a concentrations were measured as a function of depth from 28 to 48”N along 152”W in March 199 1 with Whatman GF/F and 0.2~pm Nuclepore filters. Surface Chl a concentrations measured with 0.2~ym Nuclepore filters were up to fourfold higher than those measured with Whatman GF/F filters. The largest difference between the two filter types was found in subtropical waters, where picoplankton were a major constituent of the phytoplankton assemblage. Chl a concentrations integrated from 0 to 175 m showed a threefold increase (9-26 mg Chl a m-I) between 28 and 48”N when Whatman GF/F filters were used. However, integrated Chl a concentrations based on measurements with 0.2~pm Nuclepore filters were nearly constant (25-3 1 mg Chl a mpZ) over the transect. These results lead us to question the existence of previously reported latitudinal gradients in integrated Chl a concentrations in the North Pacific Ocean. Attempts to understand the ocean’s role in global climate change require accurate estimates of phytoplankton biomass and production. Recent work has shown that picoplankton constitute a major fraction of the phytoplankton biomass in tropical, subtropical, and temperate waters. As well, these small phytoplankters have been found to contribute significantly to the primary production in openocean ecosystems (Li et al. 1983; Platt et al. 1983). However, in oligotrophic tropical and subtropical waters, where picoplankton dominate, Chl a concentrations and the level of primary production may have been underestimated due to the use of filters with inappropriate pore sizes. Numerous comparative studies of the reten- Acknowledgments We thank the captain, officers, and crew of the NOAA ship Discoverer for their cooperation and assistance during the cruise. We are grateful to Larry Small, Barry and Ev Sherr, and two anonymous reviewers for their helpful suggestions and comments. This research was supported by a NASA graduate student fellowship in global change research to M.-L.D. and a NOAA climate and global change grant (NA 16RC00901) to P.A.W. tion properties of glass-fiber and membrane filters have demonstrated that glass-fiber filters inadequately retain < 1-pm-diameter cells due to their large nominal pore size (0.7 and 1.2 pm for Whatman GF/F and GF/C filters). Low retention efficiencies of glass-fiber filters result when Chl a concentrations are low (<0.5-l .O pg Chl a liter-‘) and when picoplankton are a dominant fraction of the phytoplankton assemblage (Phinney and Yentsch 1985; Taguchi and Laws 1988). Under such conditions the use of membrane filters with submicron pore sizes has been recommended (although not always followed). Many studies have made extensive use of glass-fiber filters due to their low cost and fast flow rates. Results from previous basinwide studies have suggested the presence of a latitudinal gradient in integrated Chl a concentrations between subtropical and subarctic waters. The purpose of this study was to compare Chl a concentrations in subtropical, transition, and subarctic waters and to evaluate the existence of a meridional gradient in integrated Chl a concentrations across the North Pacific basin. Sampling was conducted from 20 to 55”N along 152”W in March 199 1 on the RV Discoverer as part of the Climate and Global Change Program of NOAA. Water samples were collected at -20-m intervals from the surface to 100 m and then every 25 m to a depth of 175 m with lo-liter Niskin bottles attached to a rosette sampler. Duplicate 200ml subsamples of seawater were filtered under low vacuum pressure (5 180 mm of Hg) onto either 25-mm-diameter combusted Whatman GF/F or 0.2~pm Nuclepore filters. Near the end of the filtration, 0.5 ml of saturated MgC03 was added to the samples. Chl a concentrations were measured with a Turner Designs 10 fluorometer after a 24-h extraction in 90% acetone at -20°C in the dark. Before the cruise, the fluorometer was calibrated with a pure Chl a standard purchased from Sigma Chemical Co. In addition, the fluorometer was also stan- 1814 Notes dardized before each use with a secondary Chl a standard, also from Sigma Chemical Co., and with 90% acetone blanks and extracted filter blanks (Whatman GF/F and Nuclepore filters) (Venrick 1987). Integrated Chl a concentrations were calculated with the trapezoid method of integration. The vertical profile of the Chl a concentration at 32”N, 152”W was not included in Fig. 1 because some of the samples may have been mixed. However, there was no significant effect on the integrated Chl a concentrations. The mean precision * 1 SD for duplicate Chl a measurements was 0.025+0.017 for GF/Ffiltersand 0.015*0.004 for 0.2~pm Nuclepore filters. In September 199 1 during a cruise off northern California, we used the same procedure outlined above to test if a difference could be detected in the amount of Chl a measured by combusted and noncombusted Whatman GF/F filters. We also checked whether lower vacuum pressure (80 mm of Hg) increased the amount of Chl a measured. The station selected for these tests was 650 km off northern California (42”N, 132”W) in oligotrophic waters characterized by low ambient nitrate concentrations (- 1 ,uM) and a low phytoplankton standing stock (-0.080-0.300 pg Chl a liter- l). This site was chosen for its similarity to stations in subtropical waters along the NOAA transect. Comparison of combusted with noncombusted Whatman GF/F filters showed no appreciable difference in the Chl a concentrations measured for two depths at the oligotrophic site off northern California (Table 1). Chl a concentrations were found to be -7% lower when the vacuum pressure was 80 mm of Hg compared to 180 mm of Hg. Chl a concentrations measured at 15 and 100 m were comparable to those encountered at the southern end of the NOAA transect. The results of these tests indicate that the low Chl a values for the Whatman GF/F filters during the NOAA transect were not due to increased porosity of the combusted Whatman GF/F filters, inappropriate vacuum pressures, or a combination of the two. Vertical profiles of Chl a concentrations at four stations extending from the central North Pacific gyre (28”N), through the transition zone (37”N), and into subarctic waters (42 and 48”N) showed very different patterns (Fig. 1). Surface Chl a concentrations measured with Whatman Table 1. Comparison of Chl a retained by combusted and noncombusted Whatman GF/F filters and by combusted filters at vacuum pressures of 80 and 180 mm of Hg. Duplicate samples were compared for each treatment. The overall precision (SD) for these measurements was 0.01, n = 6. GF/F filters (noncombusted/ combusted) Depth Cm) 15 100 Mean + SD Combusted filters (80/ 180 mm of Hg) 0.97 1.10 1.04+0.09 0.92 0.93 0.93*0.01 GF/F filters were lowest in the subtropical waand highest in ters (0.023 pg Chl a liter’) subarctic waters (0.299 pg Chl a liter-l). A deep, subsurface Chl a maximum layer (0.2500.300 pg Chl a liter-l) was located between 100 and 120 m in the subtropical and transition waters but was absent in the subarctic water at 48”N. The 0.2~pm Nuclepore filters retained 3-4 times more Chl a than the Whatman GF/F filters in subtropical waters and 23 times more Chl a in the transition zone. Chl a concentrations measured with 0.2-pm Nuclepore filters were not different from those measured with Whatman GF/F filters below 100 m in the subarctic (48”N). However, in the upper 100 m the difference in the Chl a concentrations between the two filter types was significantly different from zero (Student’s t-test, P < 0.001). The relative picoplankton abundance in the Chl a maximum layer was highest in subtropical water (85% of the total Chl a), intermediate in transition water (78% of the total Chl a), and lowest in subarctic water (35-48% of the total Chl a) (Table 2). Chl a concentrations integrated from 0 to 175 m (Fig. 2) showed a threefold increase (926 mg Chl a m-*) between 28 and 48”N when Table 2. Percent abundance of picoplankton Chl a in the Chl a maximum layer of subtropical, transition, and subarctic waters. The percentage of Chl a in the 0.2-3-pm fraction was calculated by [( >0.2 pm - > 3 pm)/>0.2 pm] x 100%. ND-No data. >0.2 I.trn >3 I.rrn % Chl a (0.2-3-wrn fraction) 0.244 0.211 0.293 0.350 0.382 0.037 0.047 ND 0.228 0.200 84.8 77.7 ND 34.9 47.6 Chl a (kg liter N lat 28” 32” 37” 42” 48” Depth (m) 100 20 100 40 6 ‘) Notes 1815 Chl a (1.19liter-‘) Chl a (pg liter-‘) 0 0.10 I I 0.20 I I 0.30 i 40 - 160 ISO/-\ Chl a (pg liter-‘) 0.10 / o-o GF-F o--o Nuclepore Chl a (pg liter-‘) 0.20 , - 120 I I I 160 ;I’ I Fig. 1. Nuclepore Vertical filters. 42”N 152” W o-o GF-F @ Nuclepore profiles of the Chl a concentrations at four locations obtained with Whatman GF/F and 0.2-hrn 1816 Notes Whatman GF/F filters were used. However, integrated Chl a concentrations for phytoplankton retained on the 0.2-pm Nuclepore filters were relatively constant along the transect (25-31 mg Chl a m-2). This result was due to a significant fraction of the Chl a in subtropical and transition waters passing through the Whatman GF/F filters but being retained by the 0.2-pm Nuclepore filters. Many investigators have been concerned about the loss of cells through glass-fiber filters and the magnitude of the problem. Most comparative studies have concluded that membrane filters retain more Chl a than glass-fiber filters, especially when Chl a concentrations are ~0.5-1 .O pg Chl a liter-l (Venrick and Hayward 1984; Phinney and Yentsch 1985). Munawar et al. (1982) found that 42% more Chl a was retained by 0.2-pm Nuclepore filters than Whatman GFK filters. Similarly, Venrick et al. (1987) reported that 0.45-pm Millipore HA filters measured 27% more Chl a than Whatman GF/C filters at 24”N in the Pacific. At 47”N the difference between the filter types was 10%. Phinney and Yentsch (1985) compared Chl a retention by 0.45~pm Millipore HA membrane filters with various types of glass-fiber filters in laboratory and field experiments. In their studies with cultured phytoplankton from four oceanic regions, they found no significant difference in the Chl a concentration measured with either the 0.45pm Millipore HA or Whatman GF/F filters. However, Whatman GF/F filters were found to be inadequate and gave variable results when used in a series of field experiments where Chl a concentrations were in the range of O-5 pg Chl a liter- l. Phinney and Yentsch concluded that under low biomass conditions the most efficient glass-fiber filters retained only 60% of the Chl a. Our data confirm that membrane filters have superior retentive properties compared to glassfiber filters but also indicate that the magnitude of the difference between the two filter types in subtropical waters may be greater than previously thought. The 0.2-pm Nuclepore filters retained 67 and 74% more Chl a than the Whatman GF/F filters at 28”N in the chlorophyll maximum layer and in the surface water, respectively. However, this difference was smaller at higher latitudes. At 48”N there was only a 1O-27% difference between the two filter types. I 30c-7 ‘E -s” 5 T< // 20- n w 5 g it / _ P // - / \ / ‘\ / ‘0’ / io- GF-F / d t t 01 I 20 I 30 I LATITUDE I 40 I 50 (“N) Fig. 2. Integrated Chl a concentrations (mg Chl a m ?) from 0 to 175 m between 28 and 48”N, 152”W calculated from Chl a concentrations determined with Whatman GF/F and 0.2~pm Nuclepore filters. Past work has indicated the existence of a steep latitudinal gradient in phytoplankton species composition, biomass (McGowan and Williams 1973) and in situ fluorescence of Chl a (Pak et al. 1988) extending from the central North Pacific subtropical gyre to subarctic waters. Originally, this gradient was defined on the basis of differences in the surface Chl a concentration between subtropical and subarctic waters. In our study, surface Chl a concentrations also showed a latitudinal gradient between southern and northern ends of the transect, regardless of the type of filter used. Data suggesting the presence of a latitudinal gradient in integrated Chl a concentrations were based on a series of basinwide cruises along 155”W that took place from 1960 to 1980. Results from these cruises have been reported elsewhere (Hayward and Venrick 1982; Hayward et al. 1983; Hayward and McGowan 1985; Hayward 1987). During these cruises were measured with Chl a concentrations Whatman GF/C filters. The latitudinal pattern that emerged from these data sets agrees with our integrated values obtained with Whatman GF/F filters. However, our integrated >0.2pm Chl a data indicate that a latitudinal gradient between subtropical and subarctic waters is weak at best when the picoplankton component of the phytoplankton assemblage is included. Pak et al. (1988) reported meridional variations in Chl a concentrations along 15 5”W in the North Pacific. Their fluorometric data show an increase in relative fluorescence between 23” and 57”N, however their extracted pigment results indicate no difference between Notes vertically integrated pigment concentrations at 28” and 42”N. It is not clear at present whether in situ fluorescence can be used as a proxy for extracted Chl a. Unfortunately there are no other basinwide data sets that include submicron Chl a with which we can compare our results with Nuclepore filters. Nonetheless, the integrated Chl a concentration measured over O-200 m at one station (28”N, 155”W) with 0.45~pm Millipore HA filters during the PRPOOS experiment was -26 mg Chl a m-2 (Venrick et al. 1987). This value closely corresponds to our estimate of 25 mg Chl a rnA2 at 28”N, 152”W from 0 to 175 m obtained with 0.2-pm Nuclepore filters, and both values exceeded the Chl a trapped on Whatman GF/F filters by almost a factor of three. We can only presume that the component of the picoplankton assemblage retained by the 0.2~pm Nuclepore and not the Whatman GF/F filters consisted of a marine prochlorophyte, Prochlorococcus. The largest discrepancy in the Chl a concentrations between filter types was found at the lower latitudes along the transect, in nutrient-poor water. This pattern is consistent with other studies reporting this taxonomic group to be numerically abundant in oligotrophic waters (Olson et al. 1990) and to contain a large fraction of the Chl a below the mixed layer (Campbell et al. unpubl.). As well, the small size of prochlorophyte cells (Chisholm et al. 1988 report a mean cell diam of 0.7 pm) makes it likely that a significant portion of the prochlorophyte population passed through the glass-fiber filters. If prochlorophytes were primarily responsible for the observed differences in Chl a concentrations, it raises the possibility that the difference between filter types might actually be larger than that observed, due to the presence of Chl b (Chisholm et al. 1988). Significant quantities of Chl b can cause overestimation in pheopigment concentrations and result in underestimation of the Chl a concentration (Loftus and Carpenter 197 1). However, LeBouteiller et al. (1992) found no bias in the Chl a estimation arising from the presence of Chl b as long as the ratio of Chl b : Chl a is < 1. They further report a maximum Chl b concentration in deep subtropical water where the Chl b : Chl a is -0.2. Thus, it seems unlikely that our Nuclepore results were influenced by the presence of Chl b. 1817 Our results suggest that historical data sets may have underestimated Chl a concentrations in subtropical and transition waters by a factor of two to four whenever glass-fiber filters were used. Primary production measurements also may have been underestimated due to the loss of small cells through glass-fiber filters. The magnitude of the underestimation may be significant when one considers that there is a linear relationship between integrated Chl a concentrations and integrated primary production (Hayward and Venrick 1982) and -60% of the primary production in tropical and subtropical waters can be attributed to picoplankton (Li et al. 1983; Platt et al. 1983; Iturriaga and Mitchell 1986). Obviously, there is a serious need to use filters with submicron pore sizes in low biomass waters to ensure accurate measurements of phytoplankton standing stocks and primary production. Mary-Lynn Dickson’ Patricia A. Wheeler College of Oceanic and Atmospheric Oregon State University Corvallis 9733 l-5503 Sciences References CHISHOLM, S. W., AND OTHERS. 1988. A novel free-living prochlorophyte abundant in the oceanic euphotic zone. Nature 334: 340-343. HAYWARD, T. L. 1987. The nutrient distribution and primary production in the central North Pacific. DeepSea Res. 34: 1593-1627. AND J. A. MCGOWAN. 1985. Spatial patterns of chlorophyll, primary production, macrozooplankton biomass, and physical structure in the central North Pacific Ocean. J. Plankton Res. 7: 147-167. -, AND E. L. VENRICK. 1982. Relation between surface chlorophyll, integrated chlorophyll and integrated primary production. Mar. Biol. 69: 247-252. -, AND J. A. MCGOWAN. 1983. Environmental heterogeneity and plankton community structure in the central North Pacific. J. Mar. Res. 41: 7 1 l729. ITURRIAGA, R., AND B. G. MITCHELL. 1986. Chromococcoid cyanobacteria: A significant component in the food web dynamics of the open ocean. Mar. Ecol. Prog. Ser. 28: 291-297. LEBOUTEILLER, A.,J. BLANCHOT,AND M. RODIER. 1992. Size distribution patterns of phytoplankton in the western Pacific: Towards a generalization for the tropical open ocean. Deep-Sea Res. 39: 805-823. I Present address: Graduate School of Oceanography, University of Rhode Island, Narragansett 02882-l 197. Notes 1818 LI, W. K. W., AND OTHERS. 1983. Autotrophic picoplankton in the tropical ocean. Science 219: 292-295. LOFKJS, M. E., AND J. H. CARPENTER. 197 1. A fluorometric method for determining chlorophylls a, b and c. J. Mar. Res. 29: 319-338. MCGOWAN, J. A., AND P. M. WILLIAMS. 1973. Oceanic habitat differences in the North Pacific. J. Exp. Mar. Biol. Ecol. 12: 187-217. MUNAWAR, M., I. F. MUNAWAR, P. E. Ross, AND A. DAGENAB. 1982. Microscopic evidence of phytoplankton passing through glass-fibre filters and its implication for chlorophyll analysis. Arch. Hydrobiol. 94: 520528. OLSON, R. J., S. W. CHISHOLM, E. R. ZETTLER, M. A. ALTABET, AND J. A. DUSENBERRY. 1990. Spatial and temporal distributions of prochlorophyte picoplankton in the North Atlantic Ocean. Deep-Sea Res. 37: 1033-1051. PAK, H., D. A. KIEFER, AND J. C. KITCHEN. 1988. Meridional variations in the concentration of chlorophyll and microparticles in the North Pacific Ocean. DeepSea Res. 35: 1151-l 171. PHINNEY, D. A., AND C. S. YENTSCH. 1985. A novel Limnol Oceanogr., 38(8), 1993, 1818-1822 0 1993, by the American Society of Limnology and Oceanography, phytoplankton chlorophyll technique: Toward automated analysis. J. Plankton Res. 7: 633-642. PLATT, T., D. V. SUBBA RAO, AND B. IRWIN. 1983. Photosynthesis of picoplankton in the oligotrophic ocean. Nature 301: 702-704. TAGUCHI, S., AND E. A. LAWS. 1988. On the micropartitles which pass through glass-fiber filter type GF/F in coastal and open waters. J. Plankton Res. 10: 9991008. VENRICK, E. L. 1987. On fluorometric determinations of filter-retained pigments. Limnol. Oceanogr. 32: 492493. -, S. L. CUMMINGS, AND C. A. KEMPER. 1987. Picoplankton and the resulting bias in chlorophyll retained by traditional glass-fiber filters. Deep-Sea Res. 34: 195 1-1956. -, AND T. L. HAYWARD. 1984. Determining chlorophyll on the 1984 CalCOFI surveys. Calif. Coop. Oceanic Fish. Invest. Rep. 25: 74-79. Submitted: 25 June 1992 Accepted: 17 March 1993 Revised: 28 April 1993 Inc Planktivore effects on zooplankton epibiont communities: Epibiont pigmentation effects Abstract-We observed the development of epibiont communities on freshwater crustacean zooplankton from 12 July-3 1 August 1991 in three ponds: one with planktivorous fish, a second with planktivorous larval salamanders, and a third with planktivorous fish added midway through the sampling period. Prevalence, on zooplankton, of pigmented euglenoid epibionts (Colucium vesiculosum), alone and with unpigmented peritrich ciliates (Vorticella campanula and Epistylis sp.), was significantly reduced by the addition of planktivorous fish in the third pond, while the prevalence of peritrich ciliates alone was not. Neither of the ponds with unaltered planktivore regimes showed a similar pattern of change in prevalence of pigmented and unpigmented epibionts on zooplankton. The relative loss of pigmented euglenoid epibionts, after planktivore addition, suggests that epibiont color or contrast may increase the susceptibility of their substrate organisms to planktivores. Acknowledgments We thank Phil Mason and Terry Schneider for assistance, and D. A. Chiavelli for editorial comments. This study was funded, in part, by a grant from the Colorado Division of Wildlife for monitoring salamander populations in western Colorado. Epibionts on zooplankton are thought to increase the visibility and vulnerability of their substrate organisms to visually orienting planktivores (Green 1974; Evans et al. 1979; Willey et al. 1990; Chiavelli et al. 1993). The effect of epibionts on zooplankton visibility seems obvious (Fig. l), has been long suggested (Green 1953, 1974), and is supported by related work which shows that eyespots and other forms of cladoceran pigmentation affect susceptibility to predators (Zaret 1972; Mellors 1975; Konecny et al. 1982). Experimental work demonstrating that epibiont-enhanced visibility is a mechanism of increased vulnerability to planktivores is still lacking (Threlkeld et al. 1993). In a series of subalpine ponds in Colorado, we observed that many epibiotic taxa, including some pigmented photosynthetic (e.g. Colacium vesiculosum) and some unpigmented heterotrophic taxa (e.g. Vorticella campanula), often coexist on the same substrate organisms (Threlkeld and Willey 1993; Willey and Threlkeld 1993). Here we present evidence that
