Variation on the Torque on Knee Experiment
advertisement

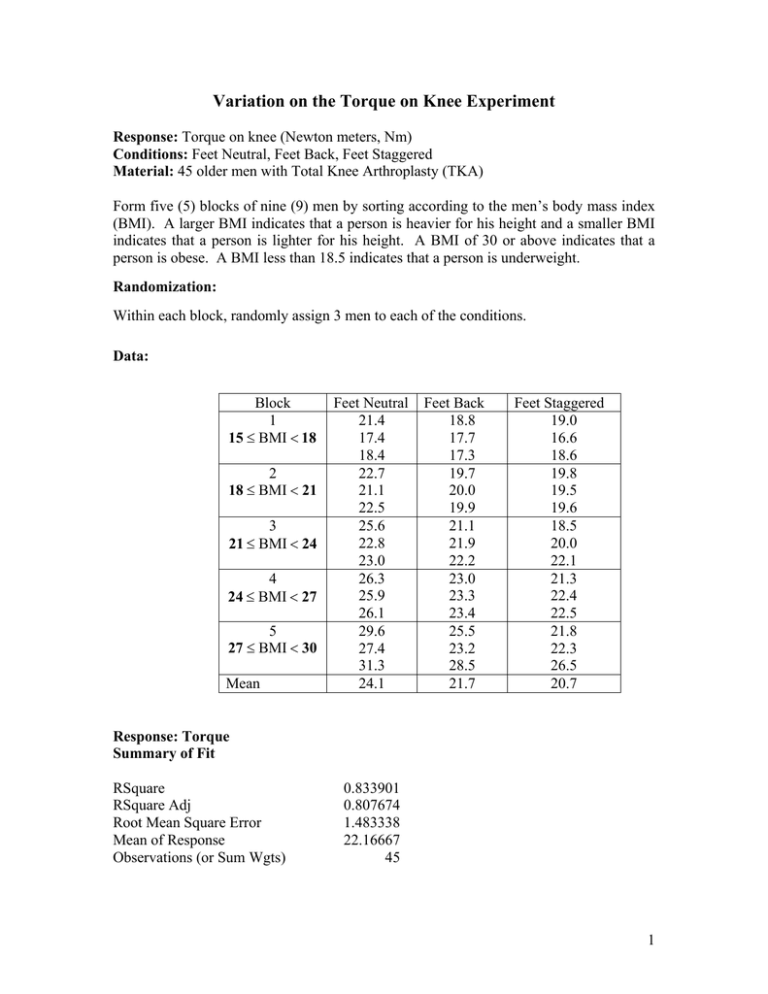
Variation on the Torque on Knee Experiment Response: Torque on knee (Newton meters, Nm) Conditions: Feet Neutral, Feet Back, Feet Staggered Material: 45 older men with Total Knee Arthroplasty (TKA) Form five (5) blocks of nine (9) men by sorting according to the men’s body mass index (BMI). A larger BMI indicates that a person is heavier for his height and a smaller BMI indicates that a person is lighter for his height. A BMI of 30 or above indicates that a person is obese. A BMI less than 18.5 indicates that a person is underweight. Randomization: Within each block, randomly assign 3 men to each of the conditions. Data: Block 1 15 BMI 18 2 18 BMI 21 3 21 BMI 24 4 24 BMI 27 5 27 BMI 30 Mean Feet Neutral 21.4 17.4 18.4 22.7 21.1 22.5 25.6 22.8 23.0 26.3 25.9 26.1 29.6 27.4 31.3 24.1 Feet Back 18.8 17.7 17.3 19.7 20.0 19.9 21.1 21.9 22.2 23.0 23.3 23.4 25.5 23.2 28.5 21.7 Feet Staggered 19.0 16.6 18.6 19.8 19.5 19.6 18.5 20.0 22.1 21.3 22.4 22.5 21.8 22.3 26.5 20.7 Response: Torque Summary of Fit RSquare RSquare Adj Root Mean Square Error Mean of Response Observations (or Sum Wgts) 0.833901 0.807674 1.483338 22.16667 45 1 Analysis of Variance Source DF Sum of Squares Model 6 419.76889 Error 38 83.61111 C. Total 44 503.38000 Lack Of Fit Source Lack Of Fit Pure Error Total Error DF 8 30 38 Effect Tests Source Nparm Method 2 Block 4 Mean Square 69.9615 2.2003 Sum of Squares 20.597778 63.013333 83.611111 DF 2 4 F Ratio 31.7964 Prob > F <.0001* Mean Square 2.57472 2.10044 Sum of Squares 91.60000 328.16889 F Ratio 20.8154 37.2870 F Ratio 1.2258 Prob > F 0.3183 Max RSq 0.8748 Prob > F <.0001* <.0001* Effect Details Method LSMeans Differences Student's t α=0.050 t=2.02439: LSD = 2.02439*(0.54164) = 1.096 LSMean[i] By LSMean[j] Mean[i]-Mean[j] Std Err Dif Lower CL Dif Upper CL Dif B N S Level N B S A B B B N S 0 0 0 0 2.4 0.54164 1.30351 3.49649 -1 0.54164 -2.0965 0.09649 -2.4 0.54164 -3.4965 -1.3035 0 0 0 0 -3.4 0.54164 -4.4965 -2.3035 1 0.54164 -0.0965 2.09649 3.4 0.54164 2.30351 4.49649 0 0 0 0 Least Sq Mean 24.100000 21.700000 20.700000 Levels not connected by same letter are significantly different. 2


