Lecture 19: Factorial Analysis - Continued Recall Experiment Analysis of Variance
advertisement
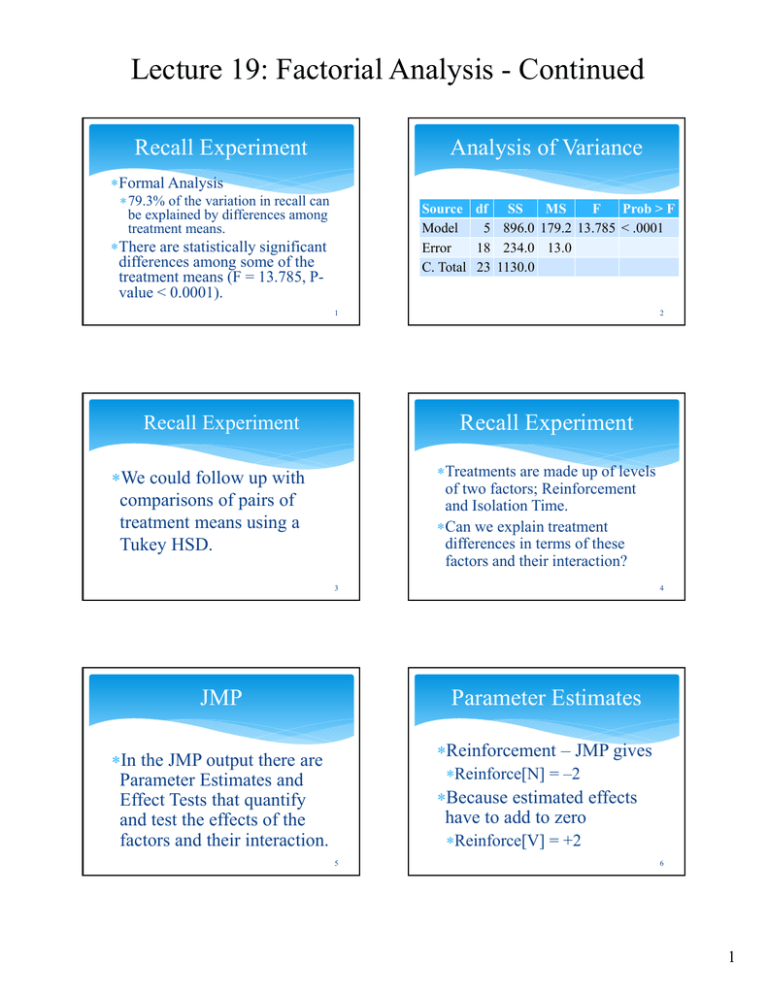
Lecture 19: Factorial Analysis - Continued Recall Experiment Analysis of Variance Formal Analysis 79.3% of the variation in recall can be explained by differences among treatment means. Source df SS MS F Prob > F Model 5 896.0 179.2 13.785 < .0001 Error 18 234.0 13.0 C. Total 23 1130.0 There are statistically significant differences among some of the treatment means (F = 13.785, Pvalue < 0.0001). 1 2 Recall Experiment Recall Experiment Treatments are made up of levels of two factors; Reinforcement and Isolation Time. Can we explain treatment differences in terms of these factors and their interaction? We could follow up with comparisons of pairs of treatment means using a Tukey HSD. 3 JMP 4 Parameter Estimates Reinforcement – JMP gives In the JMP output there are Parameter Estimates and Effect Tests that quantify and test the effects of the factors and their interaction. Reinforce[N] = –2 Because estimated effects have to add to zero Reinforce[V] = +2 5 6 1 Lecture 19: Factorial Analysis - Continued Parameter Estimates Parameter Estimates Isolation Time – JMP gives IsoTime[20] = –2.5 IsoTime[40] = 4.0 Interaction – JMP gives Reinforce[N]*IsoTime[20] = +2.5 Reinforce[N]*IsoTime[40] = +4.5 Because estimated effects have to add to zero IsoTime[60] = –1.5 7 Estimated Interaction Effects Reinforce[N] Reinforce[V] IsoTime[20] +2.5 –2.5 IsoTime[40] +4.5 –4.5 IsoTim[60] –7.0 +7.0 The estimated effects have to add to zero across rows and down columns. 8 Sum of Squares The sum of squares for a factor or interaction can be calculated by taking the weighted sum of squares estimated effects. 9 Sums of Squares 10 Sums of Squares SSReinforce=12(–2)2+12(+2)2 = 96.0 SSIsotime = 8 (–2.5)2+8(+4)2+ 8(–1.5)2=196.0 SSReinforce*IsoTime=4(+2.5)2+ 4(+4.5)2+4(–7.0)2+ 4(–2.5)2+4(–4.5)2+4(+7.0)2 = 604.0 11 12 2 Lecture 19: Factorial Analysis - Continued Full Analysis of Variance Source df SS Reinforcement 1 96.0 Isolation Time 2 196.0 Reinforce*IsoTime 2 604.0 Error 18 234.0 C. Total 23 1130.0 MS F 96.0 7.38 98.0 7.54 301.0 23.15 13.0 Reinforcement : 0 : 0 F = 7.38, P-value = 0.0141, because the P-value is so small (<0.05) there are statistically significant effects due to Reinforcement. 13 14 Reinforcement Isolation Time Because there are only two levels of Reinforcement, the two Reinforcement means are significantly different. Verbal Reinforcement produces a higher mean recall than No Reinforcement. : 0 : F = 7.54, P-value = 0.0042, because the P-value is so small (<0.05) there are statistically significant effects due to Isolation Time. 15 Isolation Time Isolation Time Follow up with pair-wise comparisons of the three Isolation Time means. 1 ∗ 2.10092 16 Comparison 20 to 40 20 to 60 40 to 60 1 13.0 Difference in Means 28.0 – 21.5 = 6.5 22.5 – 21.5 = 1.0 28.0 – 22.5 = 5.5 > LSD? Yes No Yes 2.10092(1.80278) = 3.79 17 18 3 Lecture 19: Factorial Analysis - Continued Isolation Time Interaction : 0 : F = 23.15, P-value < 0.0001, because the P-value is so small (<0.05) there is a statistically significant interaction between Reinforcement and Isolation Time. The 40 minute Isolation Time is statistically different from both the 20 minute and 60 minute Isolation Times. There is no statistically significant difference between the 20 minute and 60 minute Isolation Times. 19 Interaction Interaction 40 With Verbal Reinforcement as Isolation Time increases, average Recall increases. With No Reinforcement as Isolation Time increases, average Recall first increases then decreases, on average. 35 RecallLS Means V 30 25 20 15 N 10 5 20 40 20 60 IsoTime 21 Interaction 22 Interaction The effect of Isolation Time on Recall is different for different levels of Reinforcement. The interaction is most apparent for the change from 40 to 60 minutes of Isolation Time. 23 24 4
