Summer 2015 Student Characteristics by Attendance
advertisement
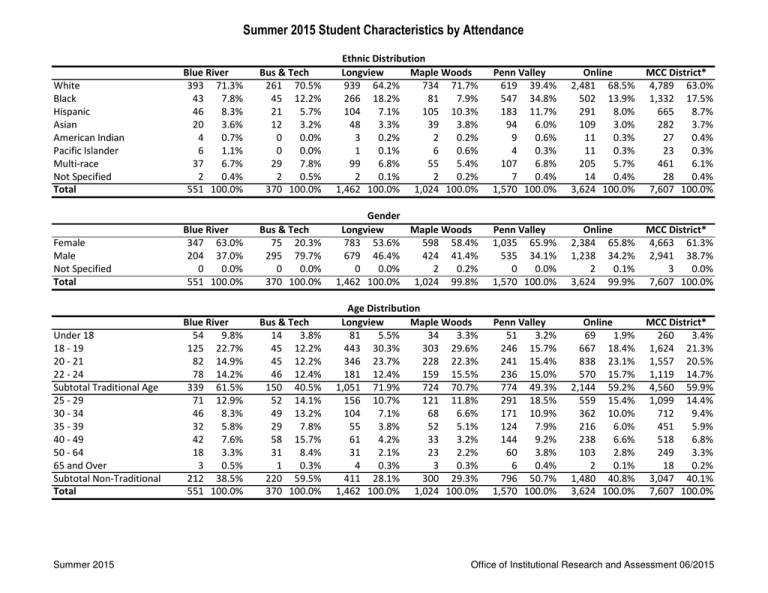
Summer 2015 Student Characteristics by Attendance White Black Hispanic Asian American Indian Pacific Islander Multi-race Not Specified Total Female Male Not Specified Total Under 18 18 - 19 20 - 21 22 - 24 Subtotal Traditional Age 25 - 29 30 - 34 35 - 39 40 - 49 50 - 64 65 and Over Subtotal Non-Traditional Total Summer 2015 Blue River 393 71.3% 43 7.8% 46 8.3% 20 3.6% 4 0.7% 6 1.1% 37 6.7% 2 0.4% 551 100.0% Blue River 347 63.0% 204 37.0% 0 0.0% 551 100.0% Blue River 54 9.8% 125 22.7% 82 14.9% 78 14.2% 339 61.5% 71 12.9% 46 8.3% 32 5.8% 42 7.6% 18 3.3% 3 0.5% 212 38.5% 551 100.0% Bus & Tech 261 70.5% 45 12.2% 21 5.7% 12 3.2% 0 0.0% 0 0.0% 29 7.8% 2 0.5% 370 100.0% Ethnic Distribution Longview Maple Woods 939 64.2% 734 71.7% 266 18.2% 81 7.9% 104 7.1% 105 10.3% 48 3.3% 39 3.8% 3 0.2% 2 0.2% 1 0.1% 6 0.6% 99 6.8% 55 5.4% 2 0.1% 2 0.2% 1,462 100.0% 1,024 100.0% Penn Valley 619 39.4% 547 34.8% 183 11.7% 94 6.0% 9 0.6% 4 0.3% 107 6.8% 7 0.4% 1,570 100.0% Online 2,481 68.5% 502 13.9% 291 8.0% 109 3.0% 11 0.3% 11 0.3% 205 5.7% 14 0.4% 3,624 100.0% MCC District* 4,789 63.0% 1,332 17.5% 665 8.7% 282 3.7% 27 0.4% 23 0.3% 461 6.1% 28 0.4% 7,607 100.0% Bus & Tech 75 20.3% 295 79.7% 0 0.0% 370 100.0% Gender Longview Maple Woods 783 53.6% 598 58.4% 679 46.4% 424 41.4% 0 0.0% 2 0.2% 1,462 100.0% 1,024 99.8% Penn Valley 1,035 65.9% 535 34.1% 0 0.0% 1,570 100.0% Online 2,384 65.8% 1,238 34.2% 2 0.1% 3,624 99.9% MCC District* 4,663 61.3% 2,941 38.7% 3 0.0% 7,607 100.0% Bus & Tech 14 3.8% 45 12.2% 45 12.2% 46 12.4% 150 40.5% 52 14.1% 49 13.2% 29 7.8% 58 15.7% 31 8.4% 1 0.3% 220 59.5% 370 100.0% Age Distribution Longview Maple Woods 81 5.5% 34 3.3% 443 30.3% 303 29.6% 346 23.7% 228 22.3% 181 12.4% 159 15.5% 1,051 71.9% 724 70.7% 156 10.7% 121 11.8% 104 7.1% 68 6.6% 55 3.8% 52 5.1% 61 4.2% 33 3.2% 31 2.1% 23 2.2% 4 0.3% 3 0.3% 411 28.1% 300 29.3% 1,462 100.0% 1,024 100.0% Penn Valley 51 3.2% 246 15.7% 241 15.4% 236 15.0% 774 49.3% 291 18.5% 171 10.9% 124 7.9% 144 9.2% 60 3.8% 6 0.4% 796 50.7% 1,570 100.0% Online 69 1.9% 667 18.4% 838 23.1% 570 15.7% 2,144 59.2% 559 15.4% 362 10.0% 216 6.0% 238 6.6% 103 2.8% 2 0.1% 1,480 40.8% 3,624 100.0% MCC District* 260 3.4% 1,624 21.3% 1,557 20.5% 1,119 14.7% 4,560 59.9% 1,099 14.4% 712 9.4% 451 5.9% 518 6.8% 249 3.3% 18 0.2% 3,047 40.1% 7,607 100.0% Office of Institutional Research and Assessment 06/2015 Summer 2015 Student Characteristics by Attendance Average Age Median Age Part-Time Full-Time Total Degree Seeking Non-Degree Seeking Total Age of Students Longview Maple Woods 24 24 20 21 Blue River 26 22 Bus & Tech 31 28 Blue River 337 61.2% 214 38.8% 551 100.0% Academic Credit Hour Load Bus & Tech Longview Maple Woods 253 68.4% 863 59.0% 595 58.1% 117 31.6% 599 41.0% 429 41.9% 370 100.0% 1,462 100.0% 1,024 100.0% Penn Valley 908 57.8% 662 42.2% 1,570 100.0% Online 1,946 53.7% 1,678 46.3% 3,624 100.0% MCC District* 4,777 62.8% 2,830 37.2% 7,607 100.0% Blue River 520 94.4% 31 5.6% 551 100.0% Student Goals Longview Maple Woods 1,374 94.0% 966 94.3% 88 6.0% 58 5.7% 1,462 100.0% 1,024 100.0% Penn Valley 1,444 92.0% 126 8.0% 1,570 100.0% Online 3,340 92.2% 284 7.8% 3,624 100.0% MCC District* 6,996 92.0% 611 8.0% 7,607 100.0% Bus & Tech 306 82.7% 64 17.3% 370 100.0% Penn Valley 28 25 Online 26 23 MCC District* 26 22 *MCC District counts are an unduplicated number of MCC students regardless of campus or campuses of attendance. NOTE: Includes students who have enrolled and attended class as of 6/12/2015 NOTE: Online includes classes that are exclusively taught online. Office of Institutional Research and Assessment Source: Research Data Warehouse State Aid Data Summer 2015 Office of Institutional Research and Assessment 06/2015
