Summer 2014 Student Characteristics by Attendance
advertisement
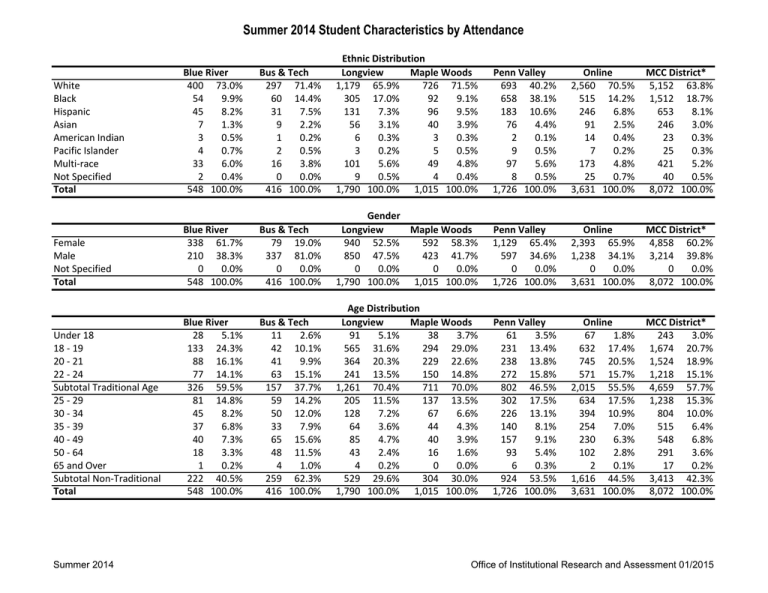
Summer 2014 Student Characteristics by Attendance White Black Hispanic Asian American Indian Pacific Islander Multi‐race Not Specified Total Female Male Not Specified Total Under 18 18 ‐ 19 20 ‐ 21 22 ‐ 24 Subtotal Traditional Age 25 ‐ 29 30 ‐ 34 35 ‐ 39 40 ‐ 49 50 ‐ 64 65 and Over Subtotal Non‐Traditional Total Summer 2014 Blue River 400 73.0% 54 9.9% 45 8.2% 7 1.3% 3 0.5% 4 0.7% 33 6.0% 2 0.4% 548 100.0% Blue River 338 61.7% 210 38.3% 0 0.0% 548 100.0% Blue River 28 5.1% 133 24.3% 88 16.1% 77 14.1% 326 59.5% 81 14.8% 45 8.2% 37 6.8% 40 7.3% 18 3.3% 1 0.2% 222 40.5% 548 100.0% Bus & Tech 297 71.4% 60 14.4% 31 7.5% 9 2.2% 1 0.2% 2 0.5% 16 3.8% 0 0.0% 416 100.0% Ethnic Distribution Maple Woods Longview 1,179 65.9% 726 71.5% 305 17.0% 92 9.1% 131 7.3% 96 9.5% 56 3.1% 40 3.9% 6 0.3% 3 0.3% 3 0.2% 5 0.5% 101 5.6% 49 4.8% 9 0.5% 4 0.4% 1,790 100.0% 1,015 100.0% Penn Valley 693 40.2% 658 38.1% 183 10.6% 76 4.4% 2 0.1% 9 0.5% 97 5.6% 8 0.5% 1,726 100.0% Online 2,560 70.5% 515 14.2% 246 6.8% 91 2.5% 14 0.4% 7 0.2% 173 4.8% 25 0.7% 3,631 100.0% MCC District* 5,152 63.8% 1,512 18.7% 653 8.1% 246 3.0% 23 0.3% 25 0.3% 421 5.2% 40 0.5% 8,072 100.0% Bus & Tech 79 19.0% 337 81.0% 0 0.0% 416 100.0% Gender Maple Woods Longview 940 52.5% 592 58.3% 850 47.5% 423 41.7% 0 0.0% 0 0.0% 1,790 100.0% 1,015 100.0% Penn Valley 1,129 65.4% 597 34.6% 0 0.0% 1,726 100.0% Online 2,393 65.9% 1,238 34.1% 0 0.0% 3,631 100.0% MCC District* 4,858 60.2% 3,214 39.8% 0 0.0% 8,072 100.0% Bus & Tech 11 2.6% 42 10.1% 41 9.9% 63 15.1% 157 37.7% 59 14.2% 50 12.0% 33 7.9% 65 15.6% 48 11.5% 4 1.0% 259 62.3% 416 100.0% Age Distribution Maple Woods Longview 91 5.1% 38 3.7% 565 31.6% 294 29.0% 364 20.3% 229 22.6% 241 13.5% 150 14.8% 1,261 70.4% 711 70.0% 205 11.5% 137 13.5% 128 7.2% 67 6.6% 64 3.6% 44 4.3% 85 4.7% 40 3.9% 43 2.4% 16 1.6% 4 0.2% 0 0.0% 529 29.6% 304 30.0% 1,790 100.0% 1,015 100.0% Penn Valley 61 3.5% 231 13.4% 238 13.8% 272 15.8% 802 46.5% 302 17.5% 226 13.1% 140 8.1% 157 9.1% 93 5.4% 6 0.3% 924 53.5% 1,726 100.0% Online 67 1.8% 632 17.4% 745 20.5% 571 15.7% 2,015 55.5% 634 17.5% 394 10.9% 254 7.0% 230 6.3% 102 2.8% 2 0.1% 1,616 44.5% 3,631 100.0% MCC District* 243 3.0% 1,674 20.7% 1,524 18.9% 1,218 15.1% 4,659 57.7% 1,238 15.3% 804 10.0% 515 6.4% 548 6.8% 291 3.6% 17 0.2% 3,413 42.3% 8,072 100.0% Office of Institutional Research and Assessment 01/2015 Summer 2014 Student Characteristics by Attendance Average Age Median Age Part‐Time Full‐Time Total Degree Seeking Non‐Degree Seeking Total Age of Students Longview Maple Woods 24 24 21 21 Penn Valley 29 25 Online 24 21 MCC District* 26 23 Blue River 26 22 Bus & Tech 32 29 Blue River 321 58.6% 227 41.4% 548 100.0% Academic Credit Hour Load Bus & Tech Longview Maple Woods 289 69.5% 1,078 60.2% 573 56.5% 127 30.5% 712 39.8% 442 43.5% 416 100.0% 1,790 100.0% 1,015 100.0% Penn Valley 1,010 58.5% 716 41.5% 1,726 100.0% Online 1,960 54.0% 1,671 46.0% 3,631 100.0% MCC District* 5,063 62.7% 3,009 37.3% 8,072 100.0% Blue River 519 94.7% 29 5.3% 548 100.0% Student Goals Longview Maple Woods 1,655 92.5% 946 93.2% 135 7.5% 69 6.8% 1,790 100.0% 1,015 100.0% Penn Valley 1,603 92.9% 123 7.1% 1,726 100.0% Online 3,303 91.0% 328 9.0% 3,631 100.0% MCC District* 7,386 91.5% 686 8.5% 8,072 100.0% Bus & Tech 355 85.3% 61 14.7% 416 100.0% *MCC District counts are an unduplicated number of MCC students regardless of campus or campuses of attendance. NOTE: Includes students who have enrolled and attended class as of 6/12/2014 NOTE: Online includes classes that are exclusively taught online. Office of Institutional Research and Assessment Source: Research Data Warehouse Summer 2014 Office of Institutional Research and Assessment 01/2015
