Introduction to the Least-Squares Regression Line response dependent
advertisement
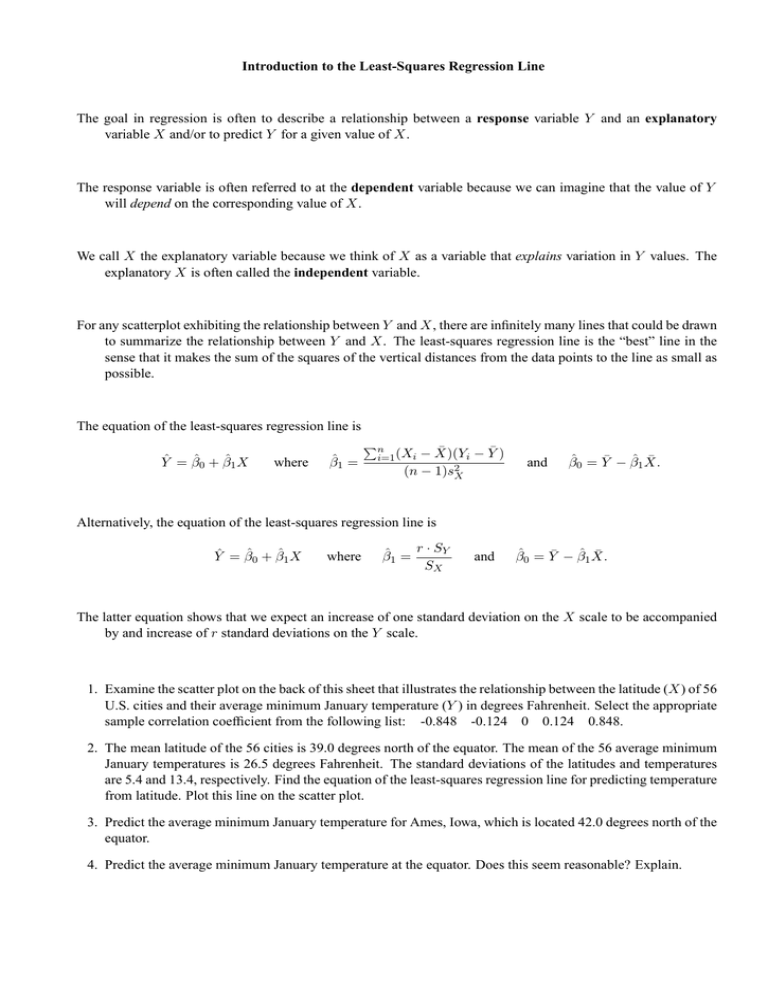
Introduction to the Least-Squares Regression Line The goal in regression is often to describe a relationship between a response variable Y and an explanatory variable X and/or to predict Y for a given value of X. The response variable is often referred to at the dependent variable because we can imagine that the value of Y will depend on the corresponding value of X. We call X the explanatory variable because we think of X as a variable that explains variation in Y values. The explanatory X is often called the independent variable. For any scatterplot exhibiting the relationship between Y and X, there are infinitely many lines that could be drawn to summarize the relationship between Y and X. The least-squares regression line is the “best” line in the sense that it makes the sum of the squares of the vertical distances from the data points to the line as small as possible. The equation of the least-squares regression line is Ŷ = β̂0 + β̂1 X where β̂1 = Pn − X̄)(Yi − Ȳ ) (n − 1)s2X i=1 (Xi and β̂0 = Ȳ − β̂1 X̄. Alternatively, the equation of the least-squares regression line is Ŷ = β̂0 + β̂1 X where β̂1 = r · SY SX and β̂0 = Ȳ − β̂1 X̄. The latter equation shows that we expect an increase of one standard deviation on the X scale to be accompanied by and increase of r standard deviations on the Y scale. 1. Examine the scatter plot on the back of this sheet that illustrates the relationship between the latitude (X) of 56 U.S. cities and their average minimum January temperature (Y ) in degrees Fahrenheit. Select the appropriate sample correlation coefficient from the following list: -0.848 -0.124 0 0.124 0.848. 2. The mean latitude of the 56 cities is 39.0 degrees north of the equator. The mean of the 56 average minimum January temperatures is 26.5 degrees Fahrenheit. The standard deviations of the latitudes and temperatures are 5.4 and 13.4, respectively. Find the equation of the least-squares regression line for predicting temperature from latitude. Plot this line on the scatter plot. 3. Predict the average minimum January temperature for Ames, Iowa, which is located 42.0 degrees north of the equator. 4. Predict the average minimum January temperature at the equator. Does this seem reasonable? Explain.


