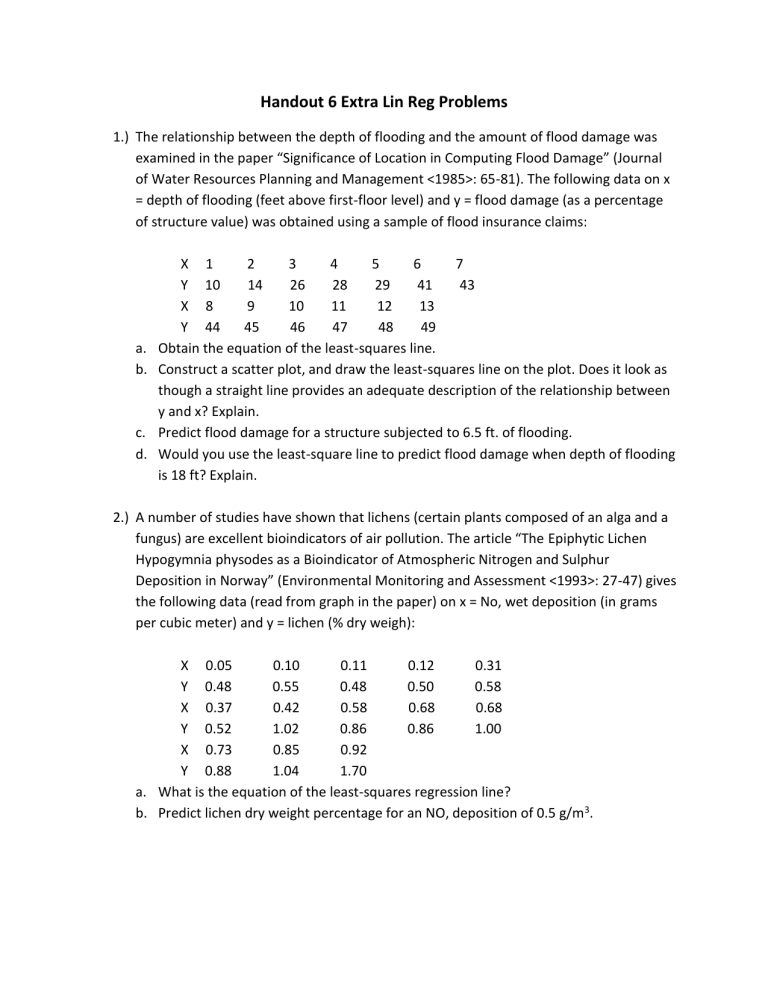
Handout 6 Extra Lin Reg Problems 1.) The relationship between the depth of flooding and the amount of flood damage was examined in the paper “Significance of Location in Computing Flood Damage” (Journal of Water Resources Planning and Management <1985>: 65-81). The following data on x = depth of flooding (feet above first-floor level) and y = flood damage (as a percentage of structure value) was obtained using a sample of flood insurance claims: a. b. c. d. X 1 2 3 4 5 6 7 Y 10 14 26 28 29 41 43 X 8 9 10 11 12 13 Y 44 45 46 47 48 49 Obtain the equation of the least-squares line. Construct a scatter plot, and draw the least-squares line on the plot. Does it look as though a straight line provides an adequate description of the relationship between y and x? Explain. Predict flood damage for a structure subjected to 6.5 ft. of flooding. Would you use the least-square line to predict flood damage when depth of flooding is 18 ft? Explain. 2.) A number of studies have shown that lichens (certain plants composed of an alga and a fungus) are excellent bioindicators of air pollution. The article “The Epiphytic Lichen Hypogymnia physodes as a Bioindicator of Atmospheric Nitrogen and Sulphur Deposition in Norway” (Environmental Monitoring and Assessment <1993>: 27-47) gives the following data (read from graph in the paper) on x = No, wet deposition (in grams per cubic meter) and y = lichen (% dry weigh): X 0.05 0.10 0.11 0.12 0.31 Y 0.48 0.55 0.48 0.50 0.58 X 0.37 0.42 0.58 0.68 0.68 Y 0.52 1.02 0.86 0.86 1.00 X 0.73 0.85 0.92 Y 0.88 1.04 1.70 a. What is the equation of the least-squares regression line? b. Predict lichen dry weight percentage for an NO, deposition of 0.5 g/m3. 3.) Athletes competing in a triathlon participated in a study described in the paper “Myoglobinemia and Endurance Exercise” (American Journal of Sports Medicine <1984>: 113-118). The following data on finishing time x (in hours) and myoglobin level y (in nanograms per millimeter) were read from a scatter plot in the paper: a. b. c. X 4.90 4.70 5.35 Y 1590 1550 X 5.40 5.70 6.00 Y 905 895 910 X 5.60 5.35 5.75 5.35 6.00 Y 540 540 440 380 300 1360 5.22 895 6.20 700 5.20 865 6.10 675 Obtain the equation of the least-squares line. Interpret the value of slope What happens if the line in part (a) is used to predict the myoglobin level for a finishing time of 8 hr? Is this reasonable? Explain. 4.) The following data on sale price, size, and land-to-building ratio for 10 large industrial properties appeared in the paper “Using Multiple Regression Analysis in Real Estate Appraisal” (Appraisal Journal <2002>: 424-430): ______________________________________________________________ Property Sale Price Size (millions (thousands Of dollars) 0f sq. ft.) 1 10.6 2166 2 2.6 751 3 30.5 2422 4 1.8 224 5 20.0 3917 6 8.0 2866 7 10.0 1698 8 6.7 1046 9 5.8 1108 10 4.5 405 a. b. c. d. Land-to-Building Ratio 2.0 3.5 3.6 4.7 1.7 2.3 3.1 4.8 7.6 17.2 Calculate and interpret the value of the correlation coefficient between sale price and size. Calculate and interpret the value of the correlation coefficient between sale price and land-tobuilding ratio. If you want to predict sale price and you could use either size or land-to-building ratio as the basis for making predictions, which would you use? Explain. Based on your choice in Part ©, find the equation of the least-squares regression line you would use for predicting y = sale price.


