MAC layer channel quality measurement in 802.11 Hamilton Institute, NUI Maynooth
advertisement

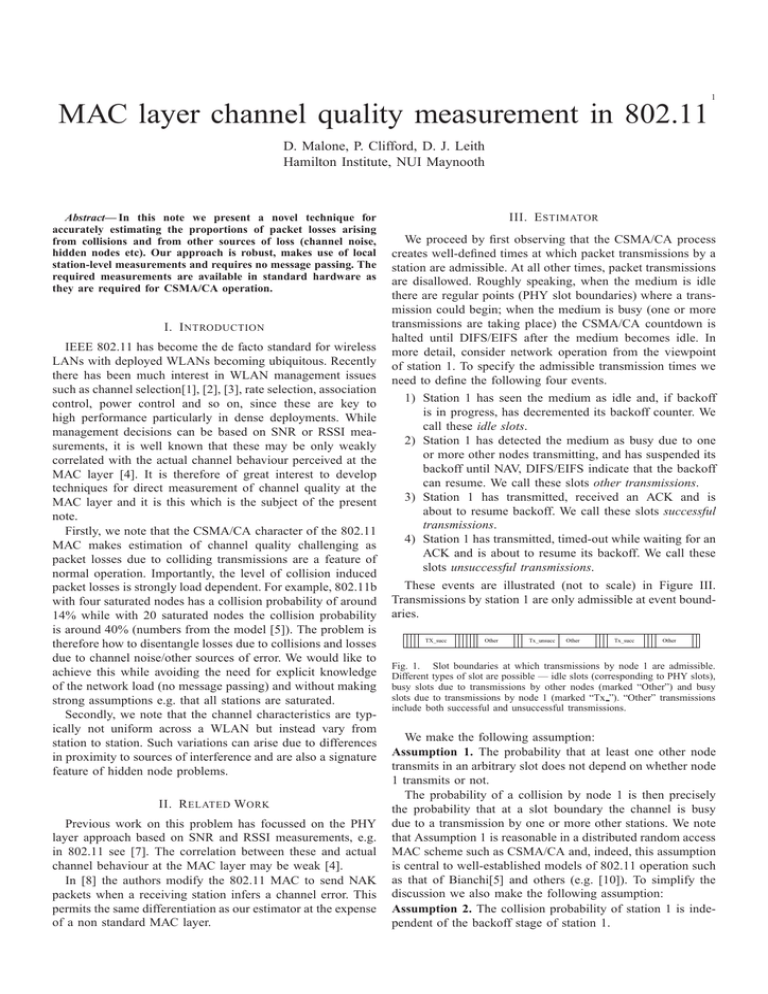
1 MAC layer channel quality measurement in 802.11 D. Malone, P. Clifford, D. J. Leith Hamilton Institute, NUI Maynooth Abstract— In this note we present a novel technique for accurately estimating the proportions of packet losses arising from collisions and from other sources of loss (channel noise, hidden nodes etc). Our approach is robust, makes use of local station-level measurements and requires no message passing. The required measurements are available in standard hardware as they are required for CSMA/CA operation. I. I NTRODUCTION IEEE 802.11 has become the de facto standard for wireless LANs with deployed WLANs becoming ubiquitous. Recently there has been much interest in WLAN management issues such as channel selection[1], [2], [3], rate selection, association control, power control and so on, since these are key to high performance particularly in dense deployments. While management decisions can be based on SNR or RSSI measurements, it is well known that these may be only weakly correlated with the actual channel behaviour perceived at the MAC layer [4]. It is therefore of great interest to develop techniques for direct measurement of channel quality at the MAC layer and it is this which is the subject of the present note. Firstly, we note that the CSMA/CA character of the 802.11 MAC makes estimation of channel quality challenging as packet losses due to colliding transmissions are a feature of normal operation. Importantly, the level of collision induced packet losses is strongly load dependent. For example, 802.11b with four saturated nodes has a collision probability of around 14% while with 20 saturated nodes the collision probability is around 40% (numbers from the model [5]). The problem is therefore how to disentangle losses due to collisions and losses due to channel noise/other sources of error. We would like to achieve this while avoiding the need for explicit knowledge of the network load (no message passing) and without making strong assumptions e.g. that all stations are saturated. Secondly, we note that the channel characteristics are typically not uniform across a WLAN but instead vary from station to station. Such variations can arise due to differences in proximity to sources of interference and are also a signature feature of hidden node problems. II. R ELATED W ORK Previous work on this problem has focussed on the PHY layer approach based on SNR and RSSI measurements, e.g. in 802.11 see [7]. The correlation between these and actual channel behaviour at the MAC layer may be weak [4]. In [8] the authors modify the 802.11 MAC to send NAK packets when a receiving station infers a channel error. This permits the same differentiation as our estimator at the expense of a non standard MAC layer. III. E STIMATOR We proceed by first observing that the CSMA/CA process creates well-defined times at which packet transmissions by a station are admissible. At all other times, packet transmissions are disallowed. Roughly speaking, when the medium is idle there are regular points (PHY slot boundaries) where a transmission could begin; when the medium is busy (one or more transmissions are taking place) the CSMA/CA countdown is halted until DIFS/EIFS after the medium becomes idle. In more detail, consider network operation from the viewpoint of station 1. To specify the admissible transmission times we need to define the following four events. 1) Station 1 has seen the medium as idle and, if backoff is in progress, has decremented its backoff counter. We call these idle slots. 2) Station 1 has detected the medium as busy due to one or more other nodes transmitting, and has suspended its backoff until NAV, DIFS/EIFS indicate that the backoff can resume. We call these slots other transmissions. 3) Station 1 has transmitted, received an ACK and is about to resume backoff. We call these slots successful transmissions. 4) Station 1 has transmitted, timed-out while waiting for an ACK and is about to resume its backoff. We call these slots unsuccessful transmissions. These events are illustrated (not to scale) in Figure III. Transmissions by station 1 are only admissible at event boundaries. TX_succ Other Tx_unsucc Other Tx_succ Other Fig. 1. Slot boundaries at which transmissions by node 1 are admissible. Different types of slot are possible — idle slots (corresponding to PHY slots), busy slots due to transmissions by other nodes (marked “Other”) and busy slots due to transmissions by node 1 (marked “Tx ”). “Other” transmissions include both successful and unsuccessful transmissions. We make the following assumption: Assumption 1. The probability that at least one other node transmits in an arbitrary slot does not depend on whether node 1 transmits or not. The probability of a collision by node 1 is then precisely the probability that at a slot boundary the channel is busy due to a transmission by one or more other stations. We note that Assumption 1 is reasonable in a distributed random access MAC scheme such as CSMA/CA and, indeed, this assumption is central to well-established models of 802.11 operation such as that of Bianchi[5] and others (e.g. [10]). To simplify the discussion we also make the following assumption: Assumption 2. The collision probability of station 1 is independent of the backoff stage of station 1. 0.7 This assumption can be relaxed at the cost of increased book-keeping in our estimator. Henceforth we use the notation pc = P[collision] and pe = P[channel error]. With the two assumptions, we have that if station 1 does not transmit, then it sees the medium busy with probability Estimated packet error probability 0.6 P[other station(s) transmit in a slot] = pc and if station 1 transmits it will be successful with probability P[success] = #successful transmits = (1 − pc )(1 − pe ). (1) #attempted transmits 0.2 y=x 0 Fig. 3. 0.1 0.2 0.3 0.4 0.5 Experienced packet error probability 0.6 0.7 Accuracy of the estimator, same scenario as in 2. dropped with a specified packet error probability parameter which is then estimated. We illustrate one set of these results in Figures 2 and 3. The stations are not saturated, i.e. the packet interarrival times are adjusted depending on the number of nodes present in order to keep the load on the medium approximately constant. The experiments are run for 50 seconds. A wide spectrum of packet errors rates ranging from 1% to 64% and range of numbers of nodes is used. Figure 2 illustrates the estimator output as the number of nodes varies. We note that the figures show the estimated packet error probability compared to the actual packet error probability experienced by the station, which is not exactly as input due to the finite duration of the experiment. Figure 3 plots the actual error probability against the estimated packet error probability. We note some spread when the error probability is small, which is to be expected as rare events are more difficult to estimate, but that on the whole the estimator is remarkably accurate over an extremely wide range of conditions. The estimator performs similarly under varying offered loads. #other transmits R−I = R #idle + #other transmits 1 − (T − A)/T 1 − pc providing 0 ≤ pe ≤ 1. Note that these estimators are very natural. The collision probability pc is estimated as the proportion of busy slots due to transmissions by other stations. The estimator for pe corresponds to solving equation 1 for pe once we know pc . 0.8 0.3 0 Hence, the maximum-likelihood estimators for the collision probability and the channel error probability are pe = 1 − 0.4 0.1 Suppose that over some time period station 1 transmits T times and of these A are successful because an ACK is received. Suppose there are also R slots in which station 1 does not transmit and that I of these are idle. The likelihood of a particular pc and pe is T L(pc , pe ) = ((1 − pc )(1 − pe ))A × A R (1 − pc )I pR−I . (1 − (1 − pc )(1 − pe ))T −A c I pc = 0.5 act est 0.7 0.14 act corruption prob est corruption prob 0.12 0.5 0.4 Packet error probability Packet error probability 0.6 0.3 0.2 0.1 0.1 0.08 0.06 0.04 0 0 5 10 15 Number of nodes 20 25 30 0.02 0 Fig. 2. Performance of the estimator for various packet error probabilities, NS simulation, 802.11b MAC. 0 5 10 15 20 25 Time (s) 30 35 40 45 50 Fig. 4. Convergence of the estimator, 10 unsaturated nodes, 802.11b MAC, 8% packet failure probability. IV. VALIDATION Figure 4 illustrates the performance of the estimator as a function of time. We observe that the estimator converges to the error probability faster than the error probability converges to its limit (.08 in this plot). Hence for a moderately loaded To evaluate the accuracy of the above estimator we performed tests over a wide range of network conditions using the NS simulator. Standard 802.11b parameters are used and stations attempt to transmit 1500 byte packets. Packets are 2 0.5 802.11b network we find that twenty seconds is enough time for the estimator to converge. est corruption prob est colprob 0.4 Normal nodes Packet error probability V. E XAMPLE : H IDDEN N ODE Interference is an important source of packet loss in dense WLAN deployments. One feature of interference losses is that the loss rate experienced can vary strongly between stations within a WLAN, depending on their location relative to those stations generating the interference. This leads to the well known hidden terminal effects that can lead to gross unfairness. Since our estimator makes use only of locally measured information, each station is able to measure its own local channel quality rather than using some WLANwide measure of interference. We illustrate this via the hidden terminal example shown in Figure 5. Here, the access point is subject to interference by the hidden terminal whereas the WLAN client stations are outside the interference range of the hidden node, leading to asymmetric channel quality within the WLAN. Figure 6 plots the estimated collision and error probabilities of the AP as the number of active client stations in the WLAN is varied. It can be seen that as the number of client stations increases, the collision probability increases, as expected, covering a range from 0% to more than 30%. The error probability, which is determined by the transmissions of the hidden node, remains constant however. The two types of failure are correctly distinguished by the estimator. In Figure 7 we vary the offered load at the hidden node while keeping the number of stations in the WLAN constant. It can be seen that the packet error rate rapidly falls as the packet interarrival time in the hidden node increases (offered load falls). This demonstrates the estimator’s ability to capture the load dependent nature of hidden node interference. 0.2 0.1 0 0 5 10 15 Number of nodes 20 25 30 Fig. 6. Estimated corruption probability as the number of normal nodes varies. All nodes saturated, 802.11b MAC, NS simulation, topology as in 5. 0.5 est corruption prob act corruption prob Packet error probability 0.4 0.3 0.2 0.1 0 0 0.02 0.04 0.06 0.08 0.1 Interpacket interval (s) 0.12 0.14 0.16 Fig. 7. Estimated versus actual corruption probabilities for one node as the load on the other (hidden) node is varied. 802.11b MAC, NS simulation, topology as in 5. R EFERENCES AP Hidden node [1] D. J. Leith, P. Clifford, “A Self-Managed Distributed Channel Selection Algorithm for WLANs”, Proc. IEEE RAWNET, Boston, 2006. [2] A. Mishra, V. Brik, S. Banerjee, A. Srinivasan, W. Arbaugh, “A Clientdriven Approach for Channel Management in Wireless LANs”, Proc. IEEE INFOCOM, Barcelona, 2006. [3] B. Kauffmann, F. Baccelli, A. Chaintreau, K. Papagiannaki, C. Diot, “Self Organization of Interfering 802.11 Wireless Access Networks”, INRIA Technical Report, August 2005. [4] D. Aguayo, J. Bicket, S. Biswa, G. Judd, R. Morris, “Link-level measurements from an 802.11b mesh network”, Proc. ACM SIGCOMM, Boston, 2004. [5] G. Bianchi, “Performance analysis of IEEE 802.11 distributed coordination function”, IEEE Journal on Selected Areas in Communications, 18(3):535-547, March 2000. [6] M. Heusse, F. Rousseau, R. Guillier, A. Duda, “Idle sense: an optimal access method for high throughput and fairness in rate diverse wireless LANs”, Proc. IEEE SIGCOMM, Philadelphia, 2005. [7] D. Qiao and Sunghyun Choi, “Goodput Enhancement of IEEE 802.11a Wireless LAN via Link Adaptation”, Proc. IEEE ICC, Finland, 2001. [8] Q. Pang, S. C. Liew, V. C. M. Leung, “Design of an Effective LossDistinguishable MAC Protocol for 802.11 WLAN”, IEEE Communications Letters, vol.9, no.9, pp. 781- 783, Sep 2005 [9] G. Yang, H. Zheng, J. Zhao, V. O. K. Li, “Adaptive Channel Selection through Collaborative Sensing”, Proc. IEEE ICC, Turkey, 2006. [10] D. Malone, K. Duffy and D.J. Leith, “Modeling the 802.11 distributed coordination function in non-saturated heterogeneous condition”, To appear in IEEE/ACM Transactions on Networking, 2007. Sample Transmission Radius Fig. 5. 0.3 Topology used in hidden node example. VI. C ONCLUSION In this note we present a novel technique for accurately estimating the proportions of packet losses arising from collisions and from other sources of loss (channel noise, hidden nodes etc). Our approach is robust, makes use of local station-level measurements and requires no message passing. No channel quality probing is required which ensures energy efficiency. The required measurements are available in standard hardware as they are required for CSMA/CA operation. Future work will include demonstration of its operation on an experimental testbed. VII. ACKNOWLEDGEMENTS This work was supported by Science Foundation Ireland grant 03/IN3/I396. 3


