Wind Turbines and Graphing DRAFT
advertisement
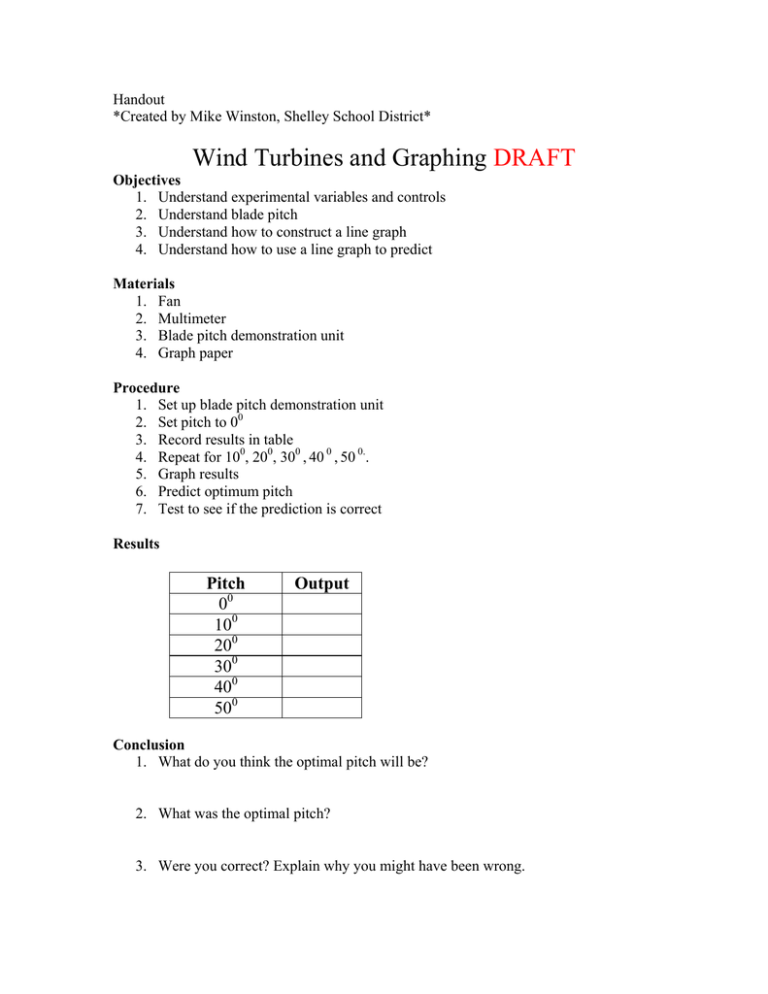
Handout *Created by Mike Winston, Shelley School District* Wind Turbines and Graphing DRAFT Objectives 1. Understand experimental variables and controls 2. Understand blade pitch 3. Understand how to construct a line graph 4. Understand how to use a line graph to predict Materials 1. Fan 2. Multimeter 3. Blade pitch demonstration unit 4. Graph paper Procedure 1. Set up blade pitch demonstration unit 2. Set pitch to 00 3. Record results in table 4. Repeat for 100, 200, 300 , 40 0 , 50 0.. 5. Graph results 6. Predict optimum pitch 7. Test to see if the prediction is correct Results Pitch 00 100 200 300 400 500 Output Conclusion 1. What do you think the optimal pitch will be? 2. What was the optimal pitch? 3. Were you correct? Explain why you might have been wrong. Blade Pitch vs Output


