BIE 5110/6110 Sprinkle & Trickle Irrigation Fall Semester, 2004 Assignment #1 (100 pts)
advertisement

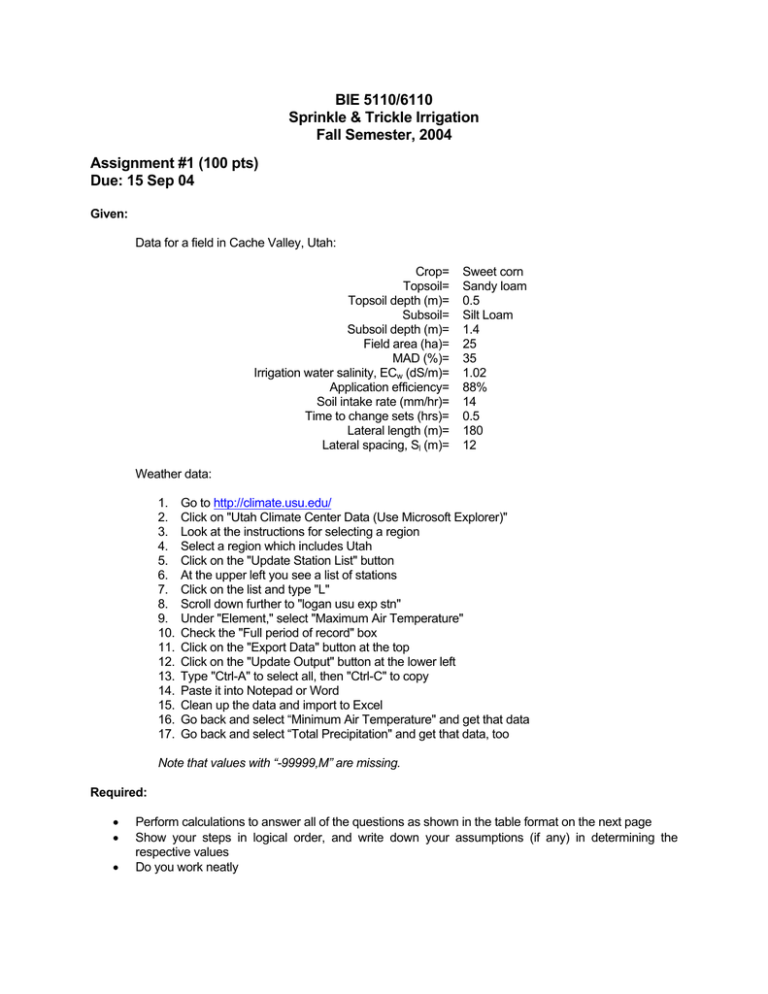
BIE 5110/6110 Sprinkle & Trickle Irrigation Fall Semester, 2004 Assignment #1 (100 pts) Due: 15 Sep 04 Given: Data for a field in Cache Valley, Utah: Crop= Topsoil= Topsoil depth (m)= Subsoil= Subsoil depth (m)= Field area (ha)= MAD (%)= Irrigation water salinity, ECw (dS/m)= Application efficiency= Soil intake rate (mm/hr)= Time to change sets (hrs)= Lateral length (m)= Lateral spacing, Sl (m)= Sweet corn Sandy loam 0.5 Silt Loam 1.4 25 35 1.02 88% 14 0.5 180 12 Weather data: 1. 2. 3. 4. 5. 6. 7. 8. 9. 10. 11. 12. 13. 14. 15. 16. 17. Go to http://climate.usu.edu/ Click on "Utah Climate Center Data (Use Microsoft Explorer)" Look at the instructions for selecting a region Select a region which includes Utah Click on the "Update Station List" button At the upper left you see a list of stations Click on the list and type "L" Scroll down further to "logan usu exp stn" Under "Element," select "Maximum Air Temperature" Check the "Full period of record" box Click on the "Export Data" button at the top Click on the "Update Output" button at the lower left Type "Ctrl-A" to select all, then "Ctrl-C" to copy Paste it into Notepad or Word Clean up the data and import to Excel Go back and select “Minimum Air Temperature" and get that data Go back and select “Total Precipitation" and get that data, too Note that values with “-99999,M” are missing. Required: • • • Perform calculations to answer all of the questions as shown in the table format on the next page Show your steps in logical order, and write down your assumptions (if any) in determining the respective values Do you work neatly Notes: 1. Many years of weather data for Logan, Utah (Experiment Station site), are given on the web site. 2. Determine the mean monthly values (Jan – Dec) of maximum daily air temperature for the entire period of record (about 34 years). To do this in Excel, you may want to use functions like COUNTIF and SUMIF. 3. Plot the mean monthly values of maximum air temperature and determine which month is the warmest; this month will be used below as the peak-use (peak ET) month. 4. Use the precipitation data to calculate the 75% rainfall probability value for the peak-use month to determine the net crop ET requirement during that month. This means you need to calculate the total rainfall (inches) for the peak-use month for the 34 years of record. You can consider that the 75% rainfall value is all “effective” rainfall for that particular month. 5. You may notice some problems with the data sets from the Utah Climate Center web site. Document these problems and describe how you have dealt with them. 6. Assume that there will be only six days of irrigation per week (one day off), even during the peak-use period. 7. Obtain needed soil, root depth, EC and ET information from tables in the text (Chapter 3), or from another source (if so, name that source). Use average values where max-min ranges are given in the tables. 8. Use Eq. 3.1 to calculate the maximum net application depth per irrigation. 9. Use Eq. 3.2 to calculate the maximum irrigation interval, then to calculate the net application depth. 10. Use Eq. 3.3 to calculate the leaching requirement. 11. Use Eqs. 5.3a and 5.3b to determine the gross application depth. 12. Use Eq. 5.4 to calculate system flow capacity. Table Format for BIE 5110/6110 Assignment #1 (Fall 2004) Given Values: Crop: ......................................................................... Topsoil depth (m):..................................................... Subsoil depth (m): .................................................... Location .................................................................... Field area (ha): ......................................................... MAD (%): .................................................................. Irrigation water salinity, ECw (dS/m):........................ Application efficiency (%): ........................................ Soil intake rate (mm/hr)............................................ Time to change sets (hrs): ....................................... Lateral length (m) ..................................................... Lateral spacing (m)................................................... Obtained from Tables and Weather Data: Average Wa of topsoil (mm/m):................................ Average Wa of subsoil (mm/m): ............................... Average root depth, Z (m):....................................... Seasonal effective rainfall at 75% prob. (mm): ....... Peak ET (mm/day): .................................................. Seasonal ET (mm): .................................................. Salinity of soil extract, ECe (dS/m): .......................... Calculated Values: Average Wa of root zone (mm/m): ........................... Maximum net depth per irrigation (mm): ................. Maximum irrigation interval (days):.......................... Nominal irrigation interval (days): ............................ Net depth per irrigation (mm):.................................. Days off in each irrigation:........................................ Operating time per irrigation (days): ........................ Leaching requirement: ............................................. Gross application depth per irrigation (mm):........... Minimum set operating time (hrs) ............................ Nominal set operating time (hrs).............................. Number of sets per day:........................................... Area per 200-m lateral per irrigation (ha): ............... Number of 200-m laterals required:......................... Approximate number of irrigations per year:........... System flow capacity (lps):....................................... Solution: To determine the mean monthly values of maximum daily air temperature, the SUMIF function was used in Excel to key on the column with the month names for the 34 years of record. The COUNTIF function was used in the same way, for each month, to determine the number of records in each month. Finally, for each month, the sum of temperature values was divided by the corresponding record count to arrive at an average monthly value: Month Count Jan 32 Feb 32 Mar 33 Apr 33 May 32 Jun 33 Jul 33 Aug 34 Sep 31 Oct 32 Nov 32 Dec 32 Sum Avg Temp 1,041 32.5 1,228 38.4 1,605 48.6 1,914 58.0 2,173 67.9 2,588 78.4 2,892 87.6 2,954 86.9 2,358 76.1 2,006 62.7 1,480 46.2 1,096 34.3 Logan, Utah (1969-2002) 90 Average Monthly Tmax (deg F) 80 70 60 50 40 30 20 10 0 Jan Feb Mar Apr May Jun Jul Aug Sep Oct Nov Dec It is seen that the month of July has the highest maximum monthly temperature for the 34 years of record, and is closely followed by August. This will be the month for which peak ET will occur in Logan, Utah. To determine the rainfall probability for the month of July, the total daily rainfall values for that month were summed up for each year of record. Following are the tabulated results: Year 1969 1970 1971 1972 1973 1974 1975 1976 1977 1978 1979 1980 1981 1982 1983 1984 1985 July Rain (inch) 0.34 0.67 0.08 0.21 0.98 0.11 1.46 0.83 0.87 0.11 0.58 1.18 0.49 1.40 1.52 1.59 1.50 Year 1986 1987 1988 1989 1990 1991 1992 1993 1994 1995 1996 1997 1998 1999 2000 2001 2002 July Rain (inch) 1.79 1.65 0.00 0.11 0.31 0.16 0.99 3.21 0.02 0.72 1.44 2.30 0.12 0.57 0.07 missing 0.38 Rain (inch) Relative Frequency Frequency From To 0.00 0.25 10 0.303 0.26 0.50 4 0.121 0.51 0.75 4 0.121 0.76 1.00 4 0.121 1.01 1.25 1 0.030 1.26 1.50 4 0.121 1.51 1.75 3 0.091 1.76 2.00 1 0.030 2.01 2.25 0 0.000 2.26 2.50 1 0.030 2.51 2.75 0 0.000 2.76 3.00 0 0.000 3.01 3.25 1 0.030 Totals: 33 1.000 Up 1.000 0.697 0.576 0.455 0.333 0.303 0.182 0.091 0.061 0.061 0.030 0.030 0.030 Down 0.303 0.424 0.545 0.667 0.697 0.818 0.909 0.939 0.939 0.970 0.970 0.970 1.000 As seen in the table above, based on the 34 years of record, there is a 69.7% probability that the total July rainfall in Logan, Utah, will be 0.26 inches or more (column “Up”). There are really not enough data points to determine the 75% level of confidence, so use 0.26 inches of rain in July (the peak ET month) with an approximately 70% level of exceedance. This is equivalent to 6.6 mm. Given Values: Crop: ......................................................................... Sweet corn Topsoil depth (m):..................................................... 0.5 m Subsoil depth (m): .................................................... 1.4 m Location .................................................................... Logan, Utah Field area (ha): ......................................................... 25 ha MAD (%): .................................................................. 35% Irrigation water salinity, ECw (dS/m):........................ 1.02 dS/m Application efficiency (%): ........................................ 88% Soil intake rate (mm/hr)............................................ 14 mm/hr Time to change sets (hrs): ....................................... 0.5 hrs Lateral length (m) ..................................................... 180 m Lateral spacing (m)................................................... 12 m Obtained from Tables and Weather Data: Average Wa of topsoil (mm/m):................................ 125 mm/m (Table 3.1, average for sandy loam) Average Wa of subsoil (mm/m): ............................... 167 mm/m (Table 3.1, average for silt loam) Average root depth, Z (m):....................................... 0.5 m (Table 3.2, average for sweet corn) Seasonal effective rainfall at 70% prob. (mm): ....... 6.6 mm (for month of July only, not season) Peak ET (mm/day): .................................................. 6.4 mm/day (Table 3.3, corn in “moderate” climate) Seasonal ET (mm): .................................................. 559 mm (Table 3.3, corn in “moderate” climate) Salinity of soil extract, ECe (dS/m): .......................... 2.5 dS/m (Table 3.5, sweet corn) Calculated Values: Note: most of the following is specifically for the peak-use period and does not dictate what the irrigation scheduling might be throughout the growing season. These are calculations leading to system design. Average Wa of root zone (mm/m): The topsoil depth is given as 0.5 m, and we have 0.5 m for the average effective root depth of sweet corn, so the subsoil Wa is not considered herein. Use Wa = 125 mm/m Maximum net depth per irrigation (mm): dx = MAD ⎛ 35 ⎞ Wa Z = ⎜ ⎟ (125 )( 0.5 ) = 21.9 mm 100 ⎝ 100 ⎠ Maximum irrigation interval (days): For July, we have determined that there is a 70% probability of a monthly total of 0.26 inches (6.6 mm), or more, of rain. This comes to an average of 6.6/31 = 0.21 mm/day, which is very little rain. This fact, together with the realization that the rain might not fall during the peak-use period, may lead us to conclude the safer choice is to assume zero effective rainfall during the peak-use period. fx = Nominal irrigation interval (days): dx 21.9 mm = = 3.42 days Ud 6.4 mm/day f ' = trunc ( fx ) = 3 days Net depth per irrigation (mm): dn = f 'Ud = ( 3 days )( 6.4 mm/day ) = 19.2 mm Days off & operating time per irrigation: The specification in this case is for one day off per week, but with f’ = 3 days, we can assume that the one day off will not fall within the three-day interval during the peak-use period, which might involve only two or three irrigations. Thus, let f = f’ = 3 days. Leaching requirement: LR = ECw 1.02 = = 0.075 5ECe − EC w 5 ( 2.5 ) − 1.02 LR < 0.1; therefore, use Eq. 5.3a... Gross application depth per irrigation (mm): d= dn 19.2 = = 21.8 mm (Ea /100 ) 0.88 Minimum set operating time (hrs): With 21.8 mm to apply and a soil intake rate of 14 mm/hr, this gives 1.56 hrs minimum set time (so as not to exceed the soil intake rate). Nominal set operating time (hrs) Make the nominal set time equal to 2.0 hours for convenience. With 0.5 hrs to move each set, there are a total of 2.5 hrs/set. Number of sets per day: With 24 hrs per day, there can be 24/2.5 = 9.6 sets/day. Round this down to a whole number: 8 sets per day, giving a total daily operations time of 8(2.5) = 20 hrs. Area per 200-m lateral per irrigation (ha): (3 days/irrigation)(8 sets/day) = 24 sets/irrigation Lateral spacing on mainline is Sl = 12 m. Lateral length is 180 m. The area per lateral is: (12 m/set)(24 sets)(180 m/lateral) = 5.18 ha/lateral Number of 180-m laterals required: 25 ha = 4.83 laterals 5.18 ha/lateral Round up to a whole number to obtain 5 laterals for the system. Alternatively, round up to 6 laterals if laterals will operate on both sides of the mainline, thereby balancing the number of laterals on each side. Approximate number of irrigations per year: Assuming zero effective rainfall during the growing season: U − Pe 559 mm - 0 mm = = 29.1 irrigations dn 19.2 mm/irrig We could do a seasonal analysis of the probability of rainfall exceedance, but we can already surmise that most of the rain will fall during times other than the peak-use period. So, to be conservative in our design, we assume no seasonal effective rainfall. On the other hand, it is very unlikely that a farmer in Logan, Utah would irrigate a corn field 29 times in a season, which could indicate a nonzero contribution from rain and or the possibility that the effective root depth for sweet corn is somewhat more than 0.5 m. Also, there may be a significant residual water content (from snowmelt and rain) in the soil at the beginning of the growing season. System flow capacity (lps): At 8 sets/day and 2.0 hours set time, there are 16 hours of system operation per day: Qs = 2.78 ( 25 ha )( 21.8 mm ) = 31.6 lps Ad = 2.78 fT ( 3 days )(16 hrs/day ) This gives a capacity of 31.6/25 = 1.26 lps per ha, which is a reasonable value.


