Document 10466251
advertisement
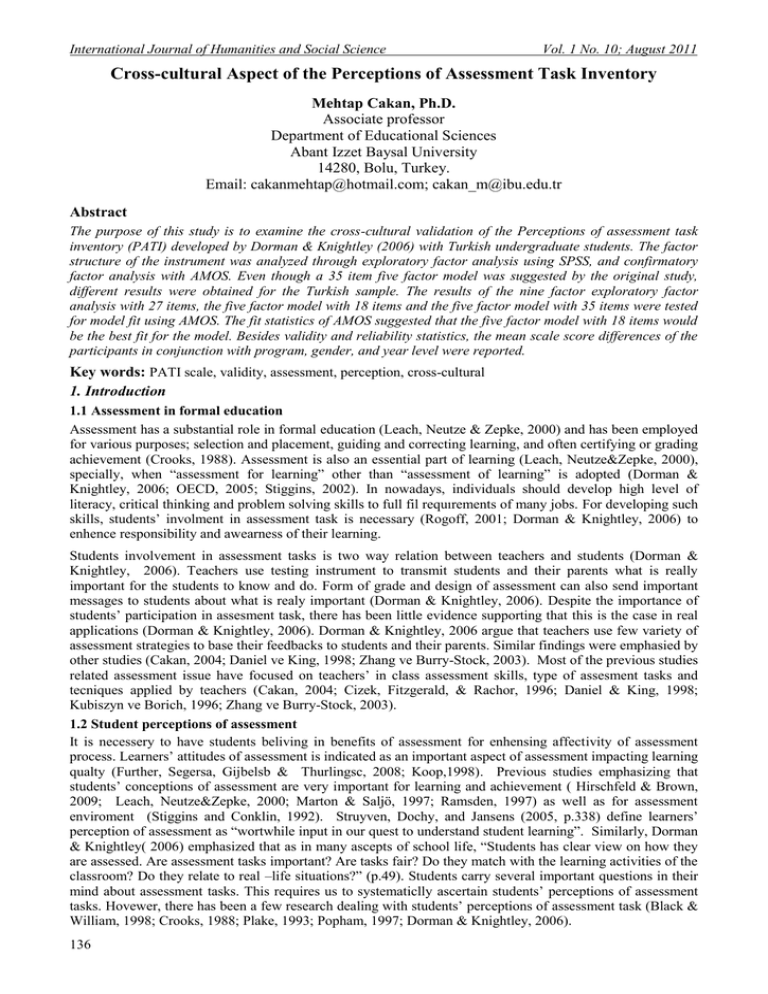
International Journal of Humanities and Social Science Vol. 1 No. 10; August 2011 Cross-cultural Aspect of the Perceptions of Assessment Task Inventory Mehtap Cakan, Ph.D. Associate professor Department of Educational Sciences Abant Izzet Baysal University 14280, Bolu, Turkey. Email: cakanmehtap@hotmail.com; cakan_m@ibu.edu.tr Abstract The purpose of this study is to examine the cross-cultural validation of the Perceptions of assessment task inventory (PATI) developed by Dorman & Knightley (2006) with Turkish undergraduate students. The factor structure of the instrument was analyzed through exploratory factor analysis using SPSS, and confirmatory factor analysis with AMOS. Even though a 35 item five factor model was suggested by the original study, different results were obtained for the Turkish sample. The results of the nine factor exploratory factor analysis with 27 items, the five factor model with 18 items and the five factor model with 35 items were tested for model fit using AMOS. The fit statistics of AMOS suggested that the five factor model with 18 items would be the best fit for the model. Besides validity and reliability statistics, the mean scale score differences of the participants in conjunction with program, gender, and year level were reported. Key words: PATI scale, validity, assessment, perception, cross-cultural 1. Introduction 1.1 Assessment in formal education Assessment has a substantial role in formal education (Leach, Neutze & Zepke, 2000) and has been employed for various purposes; selection and placement, guiding and correcting learning, and often certifying or grading achievement (Crooks, 1988). Assessment is also an essential part of learning (Leach, Neutze&Zepke, 2000), specially, when “assessment for learning” other than “assessment of learning” is adopted (Dorman & Knightley, 2006; OECD, 2005; Stiggins, 2002). In nowadays, individuals should develop high level of literacy, critical thinking and problem solving skills to full fil requırements of many jobs. For developing such skills, students’ involment in assessment task is necessary (Rogoff, 2001; Dorman & Knightley, 2006) to enhence responsibility and awearness of their learning. Students involvement in assessment tasks is two way relation between teachers and students (Dorman & Knightley, 2006). Teachers use testing instrument to transmit students and their parents what is really important for the students to know and do. Form of grade and design of assessment can also send important messages to students about what is realy important (Dorman & Knightley, 2006). Despite the importance of students’ participation in assesment task, there has been little evidence supporting that this is the case in real applications (Dorman & Knightley, 2006). Dorman & Knightley, 2006 argue that teachers use few variety of assessment strategies to base their feedbacks to students and their parents. Similar findings were emphasied by other studies (Cakan, 2004; Daniel ve King, 1998; Zhang ve Burry-Stock, 2003). Most of the previous studies related assessment issue have focused on teachers’ in class assessment skills, type of assesment tasks and tecniques applied by teachers (Cakan, 2004; Cizek, Fitzgerald, & Rachor, 1996; Daniel & King, 1998; Kubiszyn ve Borich, 1996; Zhang ve Burry-Stock, 2003). 1.2 Student perceptions of assessment It is necessery to have students beliving in benefits of assessment for enhensing affectivity of assessment process. Learners’ attitudes of assessment is indicated as an important aspect of assessment impacting learning qualty (Further, Segersa, Gijbelsb & Thurlingsc, 2008; Koop,1998). Previous studies emphasizing that students’ conceptions of assessment are very important for learning and achievement ( Hirschfeld & Brown, 2009; Leach, Neutze&Zepke, 2000; Marton & Saljö, 1997; Ramsden, 1997) as well as for assessment enviroment (Stiggins and Conklin, 1992). Struyven, Dochy, and Jansens (2005, p.338) define learners’ perception of assessment as “wortwhile input in our quest to understand student learning”. Similarly, Dorman & Knightley( 2006) emphasized that as in many ascepts of school life, “Students has clear view on how they are assessed. Are assessment tasks important? Are tasks fair? Do they match with the learning activities of the classroom? Do they relate to real –life situations?” (p.49). Students carry several important questions in their mind about assessment tasks. This requires us to systematiclly ascertain students’ perceptions of assessment tasks. Hovewer, there has been a few research dealing with students’ perceptions of assessment task (Black & William, 1998; Crooks, 1988; Plake, 1993; Popham, 1997; Dorman & Knightley, 2006). 136 © Centre for Promoting Ideas, USA www.ijhssnet.com In a study with undergraduate students, Koop (1998) suggest that, assessment place a cenral role in shaping student learning. It was further indicated that assessment, teaching and learning are highly interactive. Considering perception of assessment in higher education, literature sugeests a two-sided relationship between students’ perceptions of assessment and their approaches to learning (Struyven, Dochy, & Janssens, 2002). Similarly, Segersa, Gijbelsb and Thurlingsc (2008) suggest that other than assessment design, how the assessment is implemented and how students’ learning is stimulated through the assessment influneces the quality of learning. In a study with 4. to 12. grade students, Schaffner, Burry-Stock, Cho, Boney and Hamilton (2000) found that teachers were not consulting with students about what should be included in assessment tasks. Steinberg (2000) argue that inclution of students in the teaching- testing- grading cycle can help enhencing validity of the assessment process and can avoid invalid assessment instruments that result in very high failure rates. The strong connection between assesment and achievement as weel as its impact on learning quality requires us investigating students’ attitudes of asessment. Further, devolopment of valid and reliable instruments defining students’ attitude of assessment task is essential. Dorman & Knightley (2006) argues that lack of a validated instrumentis is one of the impediment to the systematic study of students’ perceptons of assessment tasks. Motivated with this argument, they developed and validated an instrument called “Perceptions of assessment tast inventory (PATI) “ to assess students’ perceptions of assessment. Even though they developed the instrument for science subject, they suggest that the instrument “can be easly modified to suit any curriculum area and hoped that further validation studies will be conducted in other curriculum areas, with other year levels and in other countries”( p.55). The presented study here aims to contribute to determination of cross-cultural validity of the PATI scale. 2. Methodology 2.1 Purpose The study aims to examine structural validity of the PATI scale for Turkish undergarduate students, as well as revealing discriminative validity and reliabilirt of the scale. The study also aims to investigate students’attitudes of asseesment tasks in general curriculum area in concunction with program, gender, and year level differences. 2.2 Participants Participants of the study was 567 undergraduate students from 10 different teaching programs at a university in northwestern part of Turkey during 2009-2010. The participants were pre-servise teachers. The PATI scale was administered to the participants during their class period. Distrubition of the students by gender, year, and programs were presented. There were 405 (71.4 %) female and 162 (28.6 %) male students in the study. Of the participants, 91 (16 %) were first, 123 (21.7%) were second, 263 (46.4 %) were third, and 90 (15.9 %) were fourt year students. In the study, students from different teaching programs were also presented. 2.3 Instrument Perception of Assessment Task Inventery (PATI) developed by Dorman and Knightley (2006) was adapted and applied in the study. PATI is five-scale instrument and consist of 35 items. The subscales are Congruence with planned learning, Authenticity, Student consultation, Transparency, and Diversity. Each subscale consisted of 7 items. The scale was developed to assess students’ perception of assessment tasks in science subjets. Internal consistency reliability (Cronbach coefficient ά) of the subscales ranged from. 63 for Diversity to .85 for Transparency in the orijinal study. In the Dorman and Knightley study, the five factors accounted 45.3 % of variance in the scores. Discriminative validity data was provided; the scales overlap with mean correlations ranging from 0.39 for diversity to 0.51 for Autenticity. Since the instrument was developed in English, back translation of the instrument was complated by four faculty mebmers who know English in high level. Furthermore, in the original instrument, there were some items related with science subject. These items were modified to general curriculum area as it was suggested by Dorman and Knightley (2006) . The instrument was checked for undurstanding. Then, 35 item scale was administered to the participants. 2.4 Method of analysis Explorotory factor analysis (principal component) in SPSS 16.0 was conducted using varimax rotation. Posible resultand factor models for the PATI scale were subject to confirmatory factor analysis in AMOS 16.01 and these models were compared. Fit indices and the chi-squared statistics was used to assess model fit. Further, the ECVI (expected cross validation index) statistics was applied to make direct comparisons of the models in confirmatory factor analysis. Mean score differences of the partisipants from differnt programs, and different year levels were tested through analsysis of variances. Post hoc testing was made by using Tukey test. Also, gender difference was tested through independent t- test. 137 International Journal of Humanities and Social Science Vol. 1 No. 10; August 2011 3. Results 3.1 Overview The results are preseted in four sections. The first section presents outcomes of the explarotory factor analysis on PATI scale. The second section presents the outcome of confirmatory factor analysis. In the third section, internal reliability and discriminative validity values of the final scale are reported. Finaly, in the fourth section, scale scores on the final form were investigated in terms of program, gender and yeal level differences for the participants. 3.2 Explorotory factor analysis Before employing factor analysis, assumptions of the factor analysis were tested for the data. Kaiser-MeyerOlkin measure of sampling adequicy for the factor analysis was found to be .828 which is higher than the suggested value of .60. Bartlett’s test of schericity was also found to be signicant ( p = .000). Both tests confirmed the adequacy of the data for factor analysis. For item selection two creiterian was applied; first, difference betweeen highest two factor loadings of an item prefered to be at least .10. Secondly, factor loadings of each item was prefered to be at least .40 (Buyukozturk, 2003). Result of the explorotory factor analysis suggests that 35 item PATI scale could be reduced to ten factors (Table 1). ). The model is explaining 58.36% variation in scores. However item 24, 21, 5, 33, 28, 12,and 11 had problems. They either have low lodings or difference between two highest factor loadings was smaller than .10. Also item 8 was removed from the model since it was the only item loaded on factor 10 after remowing item 11. Therefore, 9 factor model with remaing 27 item will be the first model considered through confirmatory factor analysis. When the scree plot was analysed (Figure 1), it suggests that five- factor explanation may be more parsimonious. Again, as indicated before, item 24, 21, 5, 33, and 28 had problems. Thus, theye were exclueded from the model and 5 factor model with remaining 18 item was considered. These will be the second model to be tested. And finaly, original study of the PATI scale five factor model with 35- item (Dorman& Knightley. 2006) will be the third model to be considered through confirmatory factor analysis. Insert Figure 1.about here Insert Table 1.about here 3.3 Confirmatory factor analysis Confirmatory factor analysis (CFA) for the specified models were conducted using AMOS. The results from CFA were considered using the absolute fit statistics; CFI (comparative fit index), TLI (Tucker-Lewis coefficient), RMSEA (root mean square error of approximation), chi-squared, and the ECVI as a comparative fit index to facilitate the comparison of the specified three models. To interpret the output statistics, CFI and TLI values close to 1 indicate a very good fit; RMSEA values less than 0.05 indicate a good fit and values as high as 0.08 represent reasonable errors of approximation in the population (Byrne, 2001), and the lower the ECVI value the beter the model (Mackenzie et al. 2004). Table 2 summarises these statistics for the considered models. Insert Table 2.about here As reported at Table 2, five factor model with 18 items seemed to be the best fit. This model produces the smallest value of ECVI and also chi-squared and RMSEA statistics were at more exceptable value compare to the other models. Further, out of the three models, this model produces the CFI and TLI statistics that are close to value 1. In addition to these reported three models, further possible models created with inclution of some excluded above items were also being put for confirmatory factor analysis. However none of them revealed satisfactory statistics and therefor they were not repoted here. As a result, five factor model consisted of 18 items is superior to the other models, although the absolute fit statistics suggest that it may warrant some further development. The 18 statements that contribute to this preferable five factor model are shown in Table 3. Also, Figure 2 shows the output from AMOS for this five- factor model. Insert Table 3.about here Insert Figure 2.about here Contarary to the original PATI scale, 17 items were exclueded from the scale. Yet, items can be conbined under 5 factors. Differently from the original study, factor 2 was renamed. Because, two items from “Student Consultation” and two items from “Transparency” were got together and created a new factor. Due to the context of the items, factor two was named as “Awareness”. Moreover, factor “Autenticity” repoted in the orijinal study could not be observed at Turkish data. 3.4 Reliability and discriminant validity of the final PATI scale Table 4 displays internal consistency reliability and discriminant validity data for the new PATI scale. 138 © Centre for Promoting Ideas, USA www.ijhssnet.com The overall scale and sub-scales reveals at least satisfactory internal consistency reliability. Internal consistency of the 18 item PATI scale was reported to be .75. For the sub-scales, ınternel consistency were ranging between .66 to .72 which are also in exceptable range. Table 4 also presents means, standat deviation and indices of skewness and kurtosis for each scale. Thes statistics reveal some departure from normality for the scales. Insert Table 4.about here 3.5 Mean difference of PATI scale for different programs, gender and year level Scale scores of the participants were tested in concunction with gender and program differences. Mean scores of the groups were tested. Result of analysis of variance indicated that at least two groups out of ten had different mean scores of PATI scale (F (9, 557) = 3.15. p < .01). Post-Hoc Tukey test indicated that Muzik students significantly low scored on PATI scale than Foreng language (p <.01) and painting students (p < . 01). Also Computer Education and Educational Technology students performed lower than the Foreing Language Education students(p <.05). Gender differences of the students were also tested ( t (567) = 2.89, p < . 01). Male students scored higher ( = 42.04, sd = 6.80) than the famales ( = 40.31, sd = 6.29). It was also investigatet that whether there is significant increase or decrease as the students process from first the fourt year. Analysis of variance revealed that there wasn’t any significant differenence across year levels (F (3, 563) = 2.54. p > .05). Thus, students’ attitudes revealed similar pattern throughout year level. 4. Conclusion The analysis reported here investigated the factorial and sctuctural stability of PAT scale for Turkish undergraduates. Original five factor 35-item PATI scale was put in explorotory and confirmatory analyses. The confirmatory analysis suggest that the PATI scale can best be considered as having five factor 18-item for the Turkish undergarduate students. These factors were student consultation, awareness, congruence with, diversity, and transparency. In the adaptation process, the original 35-item Patı sacle is reduced to 18 items. Differnt findings obtained in the present study, could be attributable to cultural differences and differences in assessment practices between England and Turkey. Also, since some items in the original study were modified to general curriculun area and the original study was caried out on the secondary school might be other possible considerations for the results. For further understanding, similar studies should be performed. Discriminant validity and internal reliability data suggest that the five factor 18-item model can be used to assess students’s attitude of assessment tasts regarding general curriculum area. In the study, males displayed more positive attitude toward assessment task than the females. In terms of the program differences, except students in Music program and Computer Education and Educational Technology, students revealed similar attitudes regarding the assessment tasks they encountered during their undergraduate education. Contrary to the gender and programs differences, students from different year level demostrated similar toughts regarding assessment tasks. Further validation studies cunducted in general curriculum area, in other countries, with same or other year levels would provide further validity data for the PATI scale. Such data would provide opputrunuty to make comparison over different cultures and different year levels. References Black, P. & William, D. (1998). Assessment and classroom learning. Assessment in Education, 5, 7-74. Brookhart, S.M. & Bronowicz, D. L. (2003). I don’t like writting: it makes my fingers hurt: students talk about their classroom assessments, Assessment in Education, 10, 221-242. Byrne, B. (2001). Structural equation modelling in AMOS: Basic concepts, applications, and programming. Mahwah, NJ: Lawrence Erlbaum. Buyukozturk, S. (2003) Handbook of analysis for social sciences. Ankara: Pegem publication. Cakan, M. (2004). Comparison of elementary and secondary school teachers in terms of their assessment practices and perceptions toward their qualification levels. Journal of Ankara University Science Education Faculty, 37( 2), 99-114. Cizek, G. J., Fitzgerald, S. M. & Rachor, R. E. (1996). Teachers’ assessment practices: Preparation, isolation, and the kitchen sink. Educational Assessment, 3(2), 159-179. Crooks, T. J. (1988). The impact of classroom evaluation practices on students. Review of Educational Research, 58, 438-481. Daniel, L. G. & King, D. (1998). A knowledge and use of testing and measurement literac of elementary and secondary teachers. Journal of Educational Research, 91 (6), 331-344. Dorman, J.P. & Knightley, W. M. (2006). Development and validation of an instrument to assess secondary school students’ perceptions of assessment tasks. Educational Studies, 32 (1), 47-58. Hirschfeld, G. H. F. & Brown, G. T. L. (2009). Students’ conceptions of assessment: factorial and structural invariance of the SCoA across sex, age, and ethnicity. European Journal of Psychological Assessment, 25 (1), 30-38. 139 International Journal of Humanities and Social Science Vol. 1 No. 10; August 2011 Koop, G. A. (1998). Assessment and undergraduate learning. PhD thesis, University of Westen Sydney, Australia. Kubiszyn, T. & Borich, G. (1996). Educational testing and measurement: Classroom application and practice (5th ed.). New York: HarperCollins. Leach, L., Neutze, G. & Zepke, N. (2000). Learners’ perceptions of assesment: tensions between philosophy and practice. Studies in the Education of Adults, 32 (1), 107-119. Mackenzie, C. S., Knox, V. J., Gekoski, W. L. & Macauley, H. L. (2004). An adaptation and extension of the Attitudes Towards Seeking Professional Psychological Help Scale. Journal of Applied Social Psychology, 34 (11), 2410-2435. Marton, F., & Saljö, R. (1997). Approaches to learning. In F. Marton, D.Houssell, & N.J. Entwistle (Eds.), The experience of learning: implications for teaching and studying in higher education (2nd ed., p. 39-59). Edinburgh: Scottish Academic Press. McMillan, J. H. (2000). Fundamental assessment principles for teachers and school administrators, Practical Assessment, Research and Evaluation, 7(8). Available online at:http://PAREonline.net/getvn.asp?v=7&n=8 (accessed 10 August, 2010). OECD (2005) Formative assessment: improving learning in secondary classrooms-executive summary. Available online at:http://www.oecd.org/dataoecd/32/0/34221065.pdf(accessed 13 August 2010). Plake, B. S. (1993). Teacher assessment literacy: teachers’competencyies in the educational assessment of students. Mid-Western Educational Researcher, 6, 21-27. Ramsden, P. (1997). The context of learning in academic departments. In F. Marton, D. Hounsell, & N.J. Entwistle (Eds.), The experience of learning: Implications for teaching and studing in higher education (2nd ed., p. 198-217). Edinburgh:Scottish Academic Press. Popham, W. J. (1997). Concequential validity: right cornern – wrong concept, Educational Measurement: Issues and Practice, 16(2), 9-13. Rogoff, B. (2001). Student assessment for the information age. The Chronical of Higher Education, 43(3), B17. Schaffner,M., Burry-Stock, J. A., Cho, G., Boney, T. & Hamilton, G. (2000). What do kids think when their teachers grade? Paper presented at the Annual meeting of the American Educational Research Association, New Orleans, April. Segersa, M., Gijbelsb, D. & Thurlingsc, M. (2008). The relationship between students’ perceptions of portfolio assessment practice and their approaches to learning. Educational Studies, 34 (1), 35-44. Steinberg, J. (2000). Students failure causes states to retool testing programs, New York Times, 22 December, p.A1. Stiggins, R. J. (2002). Assessment crisis: the absence of assessment for learning. Phi Delta Kappan, 83, 758-765. Stiggins, R. J. & Conklin, N. F. (1992). In teachers’ hands: Investigating the practices of classrom assessment. Albany: State University of NewYork Press. Struyven, K., Dochy, F., & Janssens, S. (2005). Students' Perceptions about Evaluation and Assessment in Higher Education: A Review. Assessment and Evaluation in Higher Education, 30 (4), 325-341. Struyven, K., Dochy, F. & Janssens, S. (2002). Student perceptions about assessment in higher education: A review. Available online at: http://www.leeds.ac.uk/ educol/ documents/00002255.htm (13 August 2010). Zhang, Z. & Burry-Stock, J. A. ( 2003). Classroom assessment practices and teachers’ self-perceived assessment skills. Applied Measurement in Education, 16 (4), 323-342. Scree Plot 7 6 Eigenvalue 5 4 3 2 1 0 1 2 3 4 5 6 7 8 9 10 11 12 13 14 15 16 17 18 19 20 21 22 23 24 25 26 27 28 29 30 31 32 33 34 35 Component Number Figure 1. Scree plot from explorotory factor analysis of PATI. 140 © Centre for Promoting Ideas, USA www.ijhssnet.com Table 1. Pattern matrices of the ten factor PATI scale. 1 Factors 2 3 4 5 6 7 8 9 10 [18] I select how I will be assessed in courses. ,752 -,021 -,018 ,124 -,060 ,020 ,129 -,050 -,115 ,072 [17] I am asked about the types of assessment I would like to have in courses. ,700 ,072 -,080 ,113 ,016 ,102 ,099 -,036 -,133 ,018 [31] I am given a choice of assessment tasks. ,652 , 009 ,137 ,078 ,031 ,261 -,090 ,181 -,055 -,044 [19] I have helped the class develop rules for assessment in courses. ,585 ,194 ,060 ,182 -,095 -,132 ,055 ,047 ,173 ,128 [20] My teachers have explained to me how each form of assessment is used. ,527 ,135 ,071 ,023 ,173 ,045 ,274 -,098 ,204 -,016 [22] I understand what is needed in all course assessment tasks. ,113 ,757 ,046 ,135 ,010 -,009 ,142 ,031 -,184 ,132 [23] I know what is needed to successfully accomplish a course assessment task ,009 ,722 ,081 ,207 ,103 ,074 ,001 ,174 -,049 ,199 [16] I am clear about the forms of assessment being used. ,166 ,618 -,099 ,014 ,046 ,055 ,045 ,051 ,358 -,131 [15] I am aware of the types of assessment in courses. -,018 ,572 -,047 -,026 ,039 -,029 ,172 ,064 ,413 -,019 [24] I know in advance how I will be assessed. ,357 ,443 ,271 ,054 ,318 ,054 -,219 ,102 ,016 ,010 [21] I ask my teachers about course assessment. ,259 ,318 ,060 ,230 -,088 ,148 ,015 -,103 ,278 -,204 [1 ] My assessment in courses is a fair indicator of my work. ,030 ,028 ,787 ,064 -,033 ,192 ,076 ,058 ,064 -,001 [4 ] My assessment is a fair indication of what I do in courses. -,051 ,066 ,770 ,094 ,120 ,135 ,204 -,034 -,062 ,050 [2 ] My tests are a fair indicator of what my class is trying to learn. ,129 -,007 ,592 -,151 ,090 ,131 ,245 ,187 ,167 ,075 [5 ] I am assessed in similar ways to the tasks I do in classes. ,133 ,018 ,402 -,047 ,151 ,020 ,216 -,131 ,147 ,357 [34] I use different assessment methods from other students. ,222 ,101 -,040 ,807 -,078 ,027 ,034 ,075 ,026 ,049 [35] I do work that is different from other students’ work. -,028 ,184 ,016 747 ,001 ,050 -,003 -,009 ,244 -,090 [32] I am set assessment tasks that are different from other students’ tasks. ,255 ,088 ,037 ,672 -,027 ,002 -,026 ,097 -,225 ,062 [33] I am given assessment tasks that suit my ability. ,431 -,072 ,070 ,459 ,060 ,111 ,087 ,062 -,078 ,248 [26] I am told in advance when I am being assessed. -,050 ,005 -,006 -,069 ,804 -,023 ,058 ,129 ,076 ,013 [27] I am told in advance on what I am being assessed. -,027 ,015 ,044 -,024 ,800 ,033 ,195 ,074 ,062 -,035 [25] I am told in advance why I am being assessed .372 ,253 ,181 -,032 ,553 ,090 -,137 -,121 ,041 ,106 [28] I understand the purpose of course assessment. -,038 ,378 ,185 ,106 ,439 ,232 ,173 ,112 ,032 ,115 [10] My course assessment tasks are useful. ,006 ,031 ,100 ,057 ,084 ,811 ,204 ,018 ,128 ,065 [9 ] My course assessment tasks are meaningful. ,171 ,068 ,205 ,032 ,023 ,768 ,044 ,007 ,080 ,022 [12] Course assessment tasks check my understanding of topics. ,067 ,017 ,228 -,030 ,046 ,467 ,424 ,090 ,045 ,134 [14] Assessment in courses examines my ability to answer important questions. ,096 ,137 ,148 ,113 ,043 ,103 ,703 ,035 ,028 -,031 [13] Assessment in courses tests my ability to apply learning. ,224 ,147 ,212 -,005 ,037 ,203 ,630 ,056 -,108 ,054 [6 ] I am assessed on what the teacher has taught me. ,016 -,020 ,134 -,066 ,232 ,043 ,448 ,029 ,212 ,189 [30] When I am faster than others. I move on to new assessment tasks. ,055 ,071 ,033 ,138 -,005 ,004 -,015 ,829 ,106 -,004 [29] I complete assessment tasks at my own speed. -,035 ,178 ,067 ,005 ,230 ,060 ,144 ,713 ,058 ,046 [7 ] I have answered questions on topics that have been covered in class. -,148 ,124 ,108 ,063 ,130 ,096 -,037 ,182 ,654 ,136 [3 ] My assignments are related to what I am learning in courses. ,030 -,096 ,188 -,072 ,145 ,232 ,335 ,039 ,455 ,202 [8 ] I am asked to apply my learning to real-life situations. ,047 ,126 ,050 ,036 ,021 ,082 ,065 ,054 ,150 ,788 [11] I find course assessment tasks relevant to the real world. ,207 ,087 ,104 ,147 -,038 ,465 ,091 ,003 -,104 ,497 Table 2. Results for confirmatory factor analysis for the three models, ordered by the ECVI statistic. Model CFI 5- factor model (18 items) .870 9- factor model (27 items) .848 5- factor model from .649 Dorman& Knightley (2006) (35 items) TLI RMSEA Chi-squared df p .841 .065 425.164 125 p< 0 .001 .800 .057 823.086 288 p< 0 .001 598 .074 2242.715 550 p< 0 .001 ECVI .977 1.868 4.369 Table 3. The PATI factor structure. Student Consultation [17] I am asked about the types of assessment I would like to have in courses. [18] I select how I will be assessed in courses. [19] I have helped the class develop rules for assessment. [20] My teachers have explained to me how each form of assessment is used. [31] I am given a choice of assessment tasks. Awareness [15] I am aware of the types of assessment in courses. [16] I am clear about the forms of assessment being used. [22] I understand what is needed in all course assessment tasks. [23] I know what is needed to successfully accomplish a course assessment task. Congruence With Planned Learning [1 ] My assessment in courses is a fair indicator of my work. [2 ] My course tests are a fair indicator of what my class is trying to learn. [4 ] My assessment is a fair indication of what I do in courses. Diversity [32] I am set assessment tasks that are different from other students’ tasks. [34] I use different assessment methods from other students. [35] I do work that is different from other students’ work. Transparency [25] I am told in advance why I am being assessed. [26] I am told in advance when I am being assessed. [27] I am told in advance on what I am being assessed. 141 International Journal of Humanities and Social Science Vol. 1 No. 10; August 2011 Figure 2. The five factor model. Table 4. Scale statistics for final form of PATI. Scale Student Consultation Awareness Congruence With Diversity Transparency Total 142 Cronbach ά ( r) .72 .70 .70 .71 .66 .75 Mean correlation .34 .37 .44 .45 .39 .15 Mean 8.90 10.61 7.51 6.11 7.68 40.81 Standard deviation 2.74 2.30 1.88 2.00 2.13 6.48 Skewness .82 -.08 .29 .66 -.21 .43 Kurtosis .35 .003 -.12 .12 -.45 .74
