Page 1 Week in Review # 1 Things to know:
advertisement
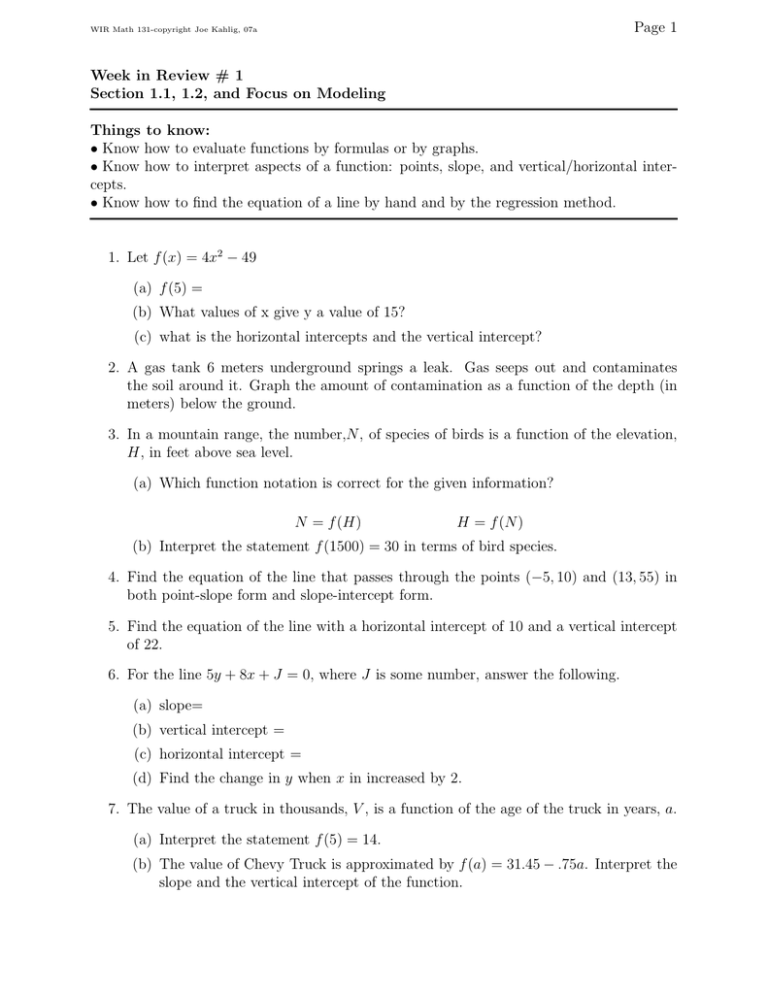
Page 1 WIR Math 131-copyright Joe Kahlig, 07a Week in Review # 1 Section 1.1, 1.2, and Focus on Modeling Things to know: • Know how to evaluate functions by formulas or by graphs. • Know how to interpret aspects of a function: points, slope, and vertical/horizontal intercepts. • Know how to find the equation of a line by hand and by the regression method. 1. Let f (x) = 4x2 − 49 (a) f (5) = (b) What values of x give y a value of 15? (c) what is the horizontal intercepts and the vertical intercept? 2. A gas tank 6 meters underground springs a leak. Gas seeps out and contaminates the soil around it. Graph the amount of contamination as a function of the depth (in meters) below the ground. 3. In a mountain range, the number,N, of species of birds is a function of the elevation, H, in feet above sea level. (a) Which function notation is correct for the given information? N = f (H) H = f (N) (b) Interpret the statement f (1500) = 30 in terms of bird species. 4. Find the equation of the line that passes through the points (−5, 10) and (13, 55) in both point-slope form and slope-intercept form. 5. Find the equation of the line with a horizontal intercept of 10 and a vertical intercept of 22. 6. For the line 5y + 8x + J = 0, where J is some number, answer the following. (a) slope= (b) vertical intercept = (c) horizontal intercept = (d) Find the change in y when x in increased by 2. 7. The value of a truck in thousands, V , is a function of the age of the truck in years, a. (a) Interpret the statement f (5) = 14. (b) The value of Chevy Truck is approximated by f (a) = 31.45 − .75a. Interpret the slope and the vertical intercept of the function. Page 2 WIR Math 131-copyright Joe Kahlig, 07a 8. The following graph shows the daily average retail price of regular gasoline in the Corpus Christi area. If the retail price, p, is a function of the number of days, t, since December 22 (i.e. t = 1 represents December 23, t = 5 represents December 27), then p = f (t). NOTE: The day 12/24 was skipped on the graph and the day 1/3 was repeated twice. Just ignore the first 1/3 on the graph. (a) What is the value of p when t is 6? (b) What is f (14)? (c) For what value(s) of t is the price $1.99? Interpret the meaning of these values of t. 9. Find the best fitting line, linear regression, for the data. x 0 6 10 12 y 63 45 27 17 15 18 10 0 10. A sample of nine adult men gave the following data on their heights and weights. Height(inches) Weight(pounds) 63 66 67 68 68 70 70 72 76 140 145 185 180 165 195 215 220 240 (a) For the data, find the linear regression equation where weight is a function of height. (b) Interpret the significance of the slope. (c) Using the regression equation, predict the weight of a man that is 67 inches tall. (d) Using the regression equation, predict the height of a guy that weighs 235 pounds.
