Study Guide 5.1
advertisement
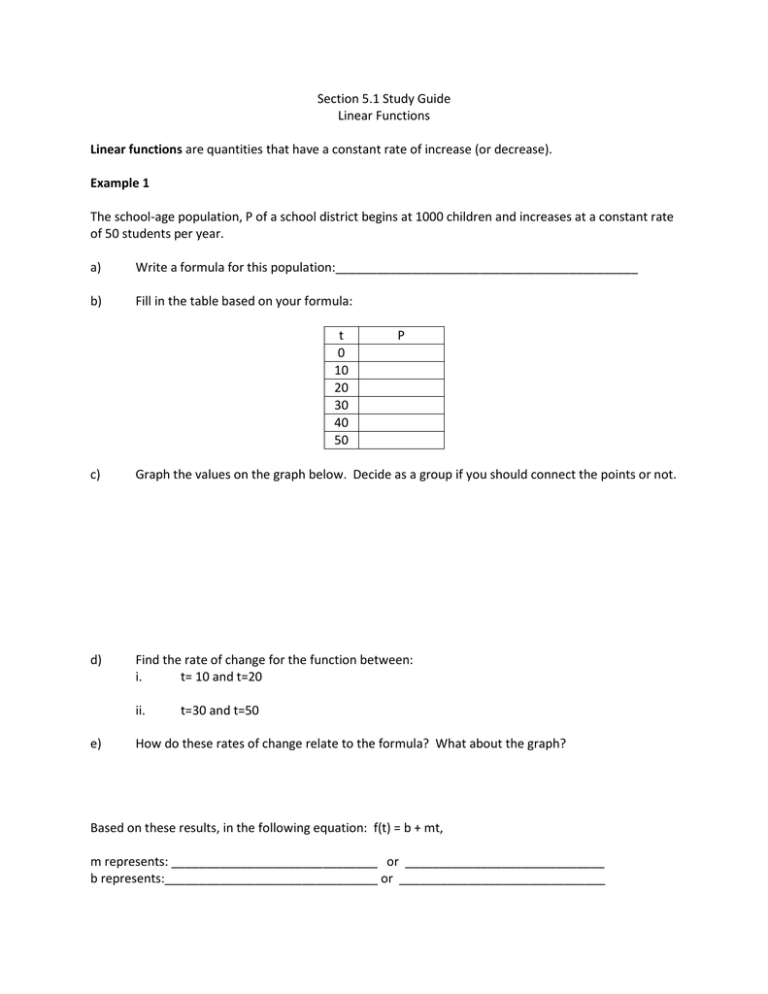
Section 5.1 Study Guide Linear Functions Linear functions are quantities that have a constant rate of increase (or decrease). Example 1 The school-age population, P of a school district begins at 1000 children and increases at a constant rate of 50 students per year. a) Write a formula for this population:____________________________________________ b) Fill in the table based on your formula: t 0 10 20 30 40 50 P c) Graph the values on the graph below. Decide as a group if you should connect the points or not. d) Find the rate of change for the function between: i. t= 10 and t=20 ii. e) t=30 and t=50 How do these rates of change relate to the formula? What about the graph? Based on these results, in the following equation: f(t) = b + mt, m represents: ______________________________ or _____________________________ b represents:_______________________________ or ______________________________ Example 2 For the function g(x) = 8 – 3x a) What does the coefficient of x tell you about the graph? b) What is the vertical intercept (y-intercept)? c) Use this information to graph the function. Example 3 The population of a town grew at a constant rate from 25,000 people in 1995 to 45,000 people in 2005. a) Find a linear function for the population, P, t years after 1995. b) Give the units and practical interpretation of the slope and vertical intercept. Work through problem 34 from p 121 below.
