T E Attachment D AX
advertisement
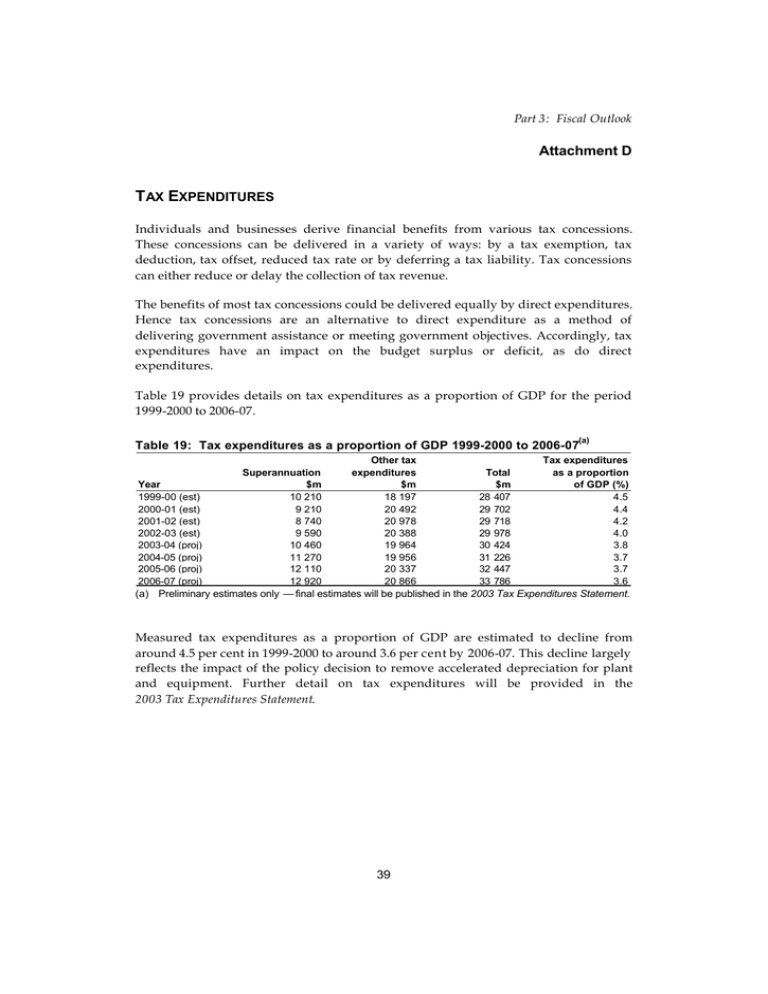
Part 3: Fiscal Outlook Attachment D T AX EXPENDITURES Individuals and businesses derive financial benefits from various tax concessions. These concessions can be delivered in a variety of ways: by a tax exemption, tax deduction, tax offset, reduced tax rate or by deferring a tax liability. Tax concessions can either reduce or delay the collection of tax revenue. The benefits of most tax concessions could be delivered equally by direct expenditures. Hence tax concessions are an alternative to direct expenditure as a method of delivering government assistance or meeting government objectives. Accordingly, tax expenditures have an impact on the budget surplus or deficit, as do direct expenditures. Table 19 provides details on tax expenditures as a proportion of GDP for the period 1999-2000 to 2006-07. (a) Table 19: Tax expenditures as a proportion of GDP 1999-2000 to 2006-07 Other tax Tax expenditures Superannuation expenditures Total as a proportion Year $m $m $m of GDP (%) 1999-00 (est) 10 210 18 197 28 407 4.5 2000-01 (est) 9 210 20 492 29 702 4.4 2001-02 (est) 8 740 20 978 29 718 4.2 2002-03 (est) 9 590 20 388 29 978 4.0 2003-04 (proj) 10 460 19 964 30 424 3.8 2004-05 (proj) 11 270 19 956 31 226 3.7 2005-06 (proj) 12 110 20 337 32 447 3.7 2006-07 (proj) 12 920 20 866 33 786 3.6 (a) Preliminary estimates only — final estimates will be published in the 2003 Tax Expenditures Statement. Measured tax expenditures as a proportion of GDP are estimated to decline from around 4.5 per cent in 1999-2000 to around 3.6 per cent by 2006-07. This decline largely reflects the impact of the policy decision to remove accelerated depreciation for plant and equipment. Further detail on tax expenditures will be provided in the 2003 Tax Expenditures Statement. 39
