Accounting for Financial Management Financial Statements Accounting for Financial Management
advertisement
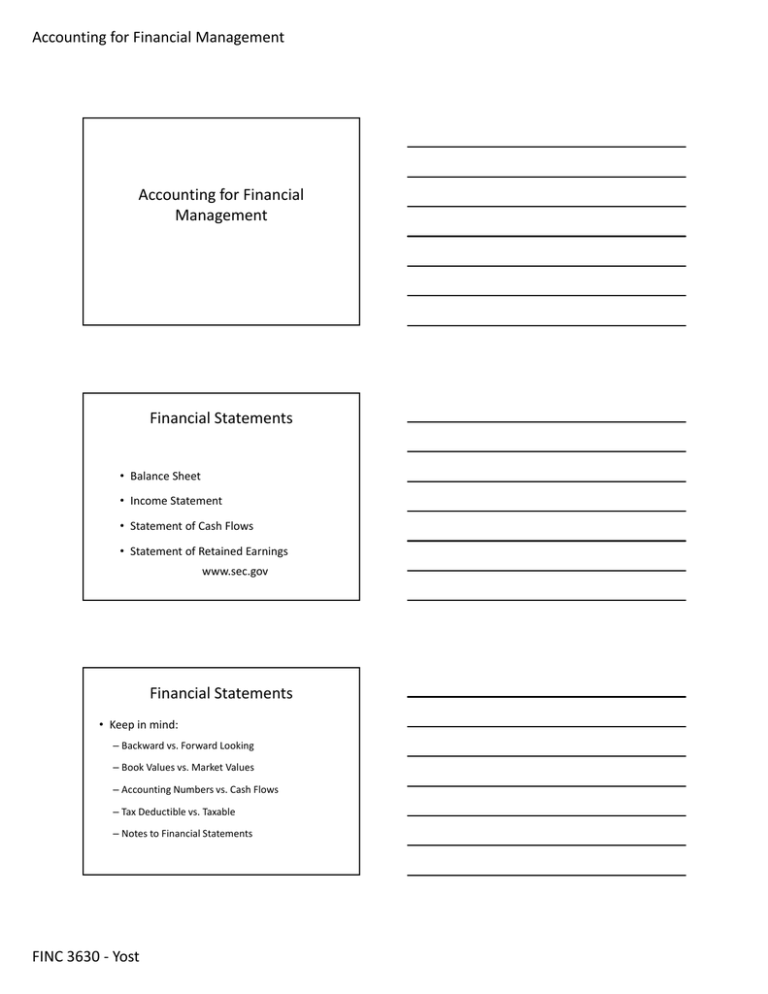
Accounting for Financial Management Accounting for Financial Management Financial Statements • Balance Sheet • Income Statement • Statement of Cash Flows • Statement of Retained Earnings www.sec.gov Financial Statements • Keep in mind: – Backward vs. Forward Looking – Book Values vs. Market Values – Accounting Numbers vs. Cash Flows – Tax Deductible vs. Taxable – Notes to Financial Statements FINC 3630 ‐ Yost Accounting for Financial Management Balance Sheet DocYost, Inc. December 31 Assets: Cash S-T invest. AR 2015 2014 7,282 20,000 9,000 48,600 632,160 351,200 Inventories 1,287,360 715,200 Total CA Gross FA 1,946,802 1,202,950 1,124,000 491,000 Less: Depr. 263,160 146,200 Net FA 939,790 344,800 2,886,592 1,468,800 Total assets Balance Sheet DocYost, Inc. December 31 Liabilities and SE: Accts. payable Notes payable Accruals Total CL Long-term debt Common stock 2015 2014 324,000 720,000 145,600 200,000 284,960 136,000 1,328,960 481,600 1,000,000 460,000 323,432 460,000 Ret. earnings 97,632 203,768 Total equity 557,632 663,768 2,886,592 1,468,800 Total L&E Income Statement DocYost, Inc. For Year Ended December 31 2015 2014 Sales 5,834,400 3,432,000 COGS 4,980,000 2,864,000 Other expenses 720,000 340,000 Deprec. 116,960 18,900 5,816,960 3,222,900 17,440 209,100 Tot. op. costs EBIT 176,000 62,500 (158,560) 146,600 Taxes (40%) (63,424) 58,640 Net income (95,136) 87,960 Int. expense EBT FINC 3630 ‐ Yost Accounting for Financial Management Sources and Uses of Cash Statement of Cash Flows DocYost, Inc. For Year Ended December 31, 2015 Operating Activities: Net Income Adjustments: Depreciation and Amort. Change in AR Change in inventories Change in AP Change in accruals Net cash provided by ops. (95,136) 116,960 (280,960) (572,160) 178,400 148,960 (503,936) Statement of Cash Flows DocYost, Inc. For Year Ended December 31, 2015 Investing Activities : Cash used to acquire FA FINC 3630 ‐ Yost (711,950) Accounting for Financial Management Statement of Cash Flows DocYost, Inc. For Year Ended December 31, 2015 Financing Activities: Change in S-T invest. Change in notes payable Change in long-term debt Payment of cash dividends Net cash provided by fin. act. Net change in cash Cash at beginning of year Cash at end of year 28,600 520,000 676,568 (11,000) 1,214,168 (1,718) 9,000 7,282 Statement of Retained Earnings DocYost, Inc. For Year Ended December 31, 2015 Balance of ret. earnings, 12/31/2014 203,768 Add: Net income, 2015 (95,136) Less: Dividends paid, 2015 (11,000) Balance of ret. earnings, 12/31/2015 Net Cash Flow • Net Cash Flow = FINC 3630 ‐ Yost 97,632 Accounting for Financial Management Operating Assets • Operating Assets = – Necessary to operate the firm – Operating Current Assets • Usually cash, accounts receivable, and inventories – Operating Long‐Term Assets • Operating Current Liabilities= – NOT capital that investors provide • Usually accounts payable and accruals Nonoperating Assets • Nonoperating Assets = – NOT necessary to operate the firm – Out of the control of management – Examples: • • • Operating Capital • Net Operating Working Capital = Operating Current Assets – Operating Current Liabilities • For example: (cash + accounts receivable + inventories) – (accounts payable + accruals) • Total Net Operating Capital = Net Operating Working Capital + Operating Long‐ Term Assets FINC 3630 ‐ Yost Accounting for Financial Management Net Operating Profit After Taxes (NOPAT) • NOPAT = • Features/Uses: – Ignores ____________________________ • Can compare companies with different capital structures – Gives Profit from Operations Free Cash Flow (FCF) • FCF = – Cash flow available to investors after necessary investment in fixed assets and working capital • Net Investment in Operating Capital = – • Gross Investment in Operating Capital = – Free Cash Flow (FCF) • FCF = – – FINC 3630 ‐ Yost Accounting for Financial Management Uses of Free Cash Flow (FCF) 1. 2. 3. 4. 5. Return on Invested Capital (ROIC) • ROIC = • Goal: Taxes • Average vs. Marginal Tax Rates • Corporate Taxes: – Capital Gains • Taxed as ordinary income – Dividends Received • If own < 20%, can exclude 70% • If own > 20% but < 80%, can exclude 80% • If own > 80%, can exclude 100% – Interest FINC 3630 ‐ Yost Accounting for Financial Management 2011 Corporate Tax Rates Taxable Income Tax on Base 0 -50,000 0 Rate on amount above base 15% 50,000 - 75,000 7,500 25% 75,000 - 100,000 13,750 34% 100,000 - 335,000 335,000 - 10M 22,250 113,900 39% 34% 10M - 15M 3,400,000 35% 15M - 18.3M 5,150,000 38% 18.3M and up 6,416,667 35% Taxes • Corporate Taxes: – Tax loss carry‐backs and carry‐forwards • 2 years back • 20 years forward Taxes • Personal Taxes: – Capital Gains • If own < 1 year, taxed as ordinary income • If own > 1 year, taxed at lower rate – Dividends • Taxed at lower rate – Interest – Munis – S‐Corporations vs. C‐Corporations FINC 3630 ‐ Yost Accounting for Financial Management Market Value Added (MVA) • MVA= – Over life of a company – Market value of stock – equity supplied by shareholders – – – Total market value of firm – total capital Economic Value Added (EVA) • EVA = – Over period of time – Measures true economic profit – Can be applied to divisions – NOPAT – After‐tax cost of capital used to support operations – – MVA and EVA for Home Depot • What do we need? • Where do we find it? • What are MVA and EVA? FINC 3630 ‐ Yost Accounting for Financial Management Chapter 7 Suggested Problems • Questions: – 7‐3, and 7‐5 through 7‐7 • Problems: – 7‐1, 7‐2, 7‐3, 7‐10, and 7‐12 FINC 3630 ‐ Yost
