Nessun titolo diapositiva - Banca CR Firenze -------------
advertisement
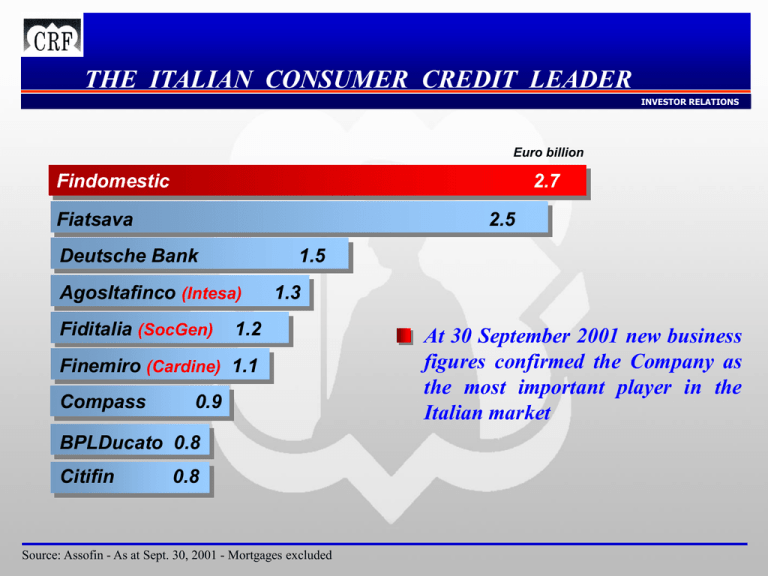
THE ITALIAN CONSUMER CREDIT LEADER INVESTOR RELATIONS Euro billion Findomestic 2.7 Fiatsava 2.5 Deutsche Bank 1.5 AgosItafinco (Intesa) Fiditalia (SocGen) 1.3 1.2 Finemiro (Cardine) 1.1 Compass 0.9 BPLDucato 0.8 Citifin 0.8 Source: Assofin - As at Sept. 30, 2001 - Mortgages excluded At 30 September 2001 new business figures confirmed the Company as the most important player in the Italian market EFFICIENCY INVESTOR RELATIONS Outperforming growth and steady reduction of credit losses 34.0% 35.1% NPL ratio* 28.8% 30.0% 29.3% 33.2% 1997 1.39% 1998 20.5% 1.22% 22.6% 1999 18.0% 1.15% 14.7% 2000 1.00% 2001 < 1.00% 1996 1997 1998 1999 Findomestic, new business (yoy %) 2000 System average : 2 % Italy, new business (yoy %) *As % of outstanding credits - Source : Assofin 2 BUSINESS SEGMENTATION INVESTOR RELATIONS INVESTOR RELATIONS Revolving cards Personal loans 26% 18% Other 3% 29% 24% Home appliances Vehicle financing September 30, 2001 - New business volume : Euro 2.7 Billion 3 FINDOMESTIC BANCA INVESTOR RELATIONS THE CARDS BUSINESS 4 THE AURA CARD INVESTOR RELATIONS FLEXIBILITY ISSUERS Retailers 400 Banks & Insurance co. 29 Revolving system Euro 4,000 credit line Monthly repayment : from 5% to 10% of outstanding debit SHOPPING Outlets 65,000 Cash advance via Internet-Phone-ATM 5 THE AURA CARD : multibranding INVESTOR RELATIONS 2,200,000* cardholders among proprietary, private label and bank cards * FY 2001E, all brands managed cards (Aura: 2,000,000) 6 BUSINESS CONTRIBUTION to the FINANCIAL MARGIN INVESTOR RELATIONS INVESTOR RELATIONS Aura : a growing business and a high contribution 100% 25% 45% 26% 16% 33% 24% 17% 14% 0% Outstanding credits Revolving cards FY 2001E Personal loans Financial margin Home appliances Vehicle financing 7 FUTURE TREND INVESTOR RELATIONS Comparison with more developed markets shows room for a further increase in consumer credit 20.00% ITA ‘91 ITA ‘00 10.00% UK ‘91 USA ‘91 Savings ratio EU 8.8% 0.00% 0.00% Source : Merrill Lynch UK ‘00 USA ‘00 12.50% Cons. credit / GDP 25.00% 8 EUROPE GOES REVOLVING INVESTOR RELATIONS Findomestic is already there 28% 26% 18% 3% 9% 21% 29% 24% 8% 34% ASSOFIN Italy FINDOMESTIC EUROFINAS - Europe 10% 8% 9% 16% 57% Revolving cards Personal loans Home appliances Vehicle financing 9 INVESTOR RELATIONS BACK-UP SLIDES March 2002 - U.S.A. Banca CR Firenze Spa - FY 2001 preliminary results INVESTOR RELATIONS 2000 2001E Variation NET INTEREST INCOME 309.6 357.7 15.5% Fees & Commissions 263.0 256.5 -2.5% Personnel costs* 231.9 230.1 -0.8% Total operating costs* 378.2 379.4 FLAT CORE OPERATING INCOME** 572.7 614.2 7.3% INCOME before Expceptionals 126.5 142.2 12.4% 79.9 84.9 6.3% Euro millions NET INCOME *Exceptional costs excluded ** Operating income, trading income excluded 11 Customer base segmentation INVESTOR RELATIONS Top 1% 5,000 > 25 Big 6% > 2.5 17.5% 82% CORPORATE Mid-size 9% >1 0.5% Small 20% > 0,25 Micro 64% Assets - Euro 75,000 500,000 Retail Affluent Private customers 800,000 Companies 100,000 Private Bkg. Group - FY 2001E 12 AFTER THE 11TH of September 2001 : loans by sensitivity INVESTOR RELATIONS High diversification of credits coupled with a high rating average Business sector 9% 45% 42% Hotels, Energy, Transports (air & land) 4% Commerce, Textile, Communications, Transport (dometic) HIGH Metallurgy MEDIUM Rubber & Plastic goods Rating average 3.2 3.2 3.1 Level of risk LOW VERY LOW Non-financial and family companies Agriculture, Food, Housing, Chemical, Paper Industry 3.2 13 Comparables INVESTOR RELATIONS A correct peers selection allows useful performance monitoring B. Pop. COMM. & INDUSTRIA Market Cap. > Eur 1,000 mn* B. Pop. EMILIA ROMAGNA MONTE PASCHI SIENA B. Pop. BERGAMO - CV “Popolari” banks with a regional presence B. Pop. SONDRIO B. Pop. NOVARA B. Pop. VERONA Area competitors B. Pop. MILANO B. LOMBARDA B. Pop. LODI B. CARIGE As at Feb.16, 2001 - Source : Prometeia Calcolo 14 GROUP INTEGRATION - The Financial Department INVESTOR RELATIONS Complete reorganization in order to achieve : greater efficiency of each business line synergies (product side, cost side…) stronger commitment in results by each Business Unit Head of Group Finance Trading & Investment Customer Finance Treasury Proprietary portfolio Customer sales - Sales - Derivatives desk Money market Trading portfolio Asset /Liabilities Mng. A 22% reduction in personnel cost Group Network 15 3 Quarter 2001 - Consolidated results INVESTOR RELATIONS ‘01 -‘00 Var. Sept. 2001 Sept. 2000 PF Euro million Net Interest income 348.0 381.4 9.6% Non-interest income 283.0 270.0 -4.6% Net commissions & other net income 238.7 238.7 FLAT Financial Income 20.5 7.8 -62.0% Dividends 9.2 16.0 73.9% Equity investments 14.6 7.5 -48.6% TOTAL INCOME 631.0 651.3 3.2% 16 3 Quarter 2001 - Consolidated results INVESTOR RELATIONS ‘01 -‘00 Var. Sept. 2000 PF Sept. 2001 404.5 404.8 FLAT 43.6 46.5 6.7% Operating income 183.1 200.0 9.2% CORE OPERATING INCOME* 162.6 192.2 18.2% 47.4 53.2 12.2% Pre-tax profit 127.6 143.8 12.7% NET INCOME 56.6 65.4 15.5% Euro millions Administrative expenses Amortization of fixed assets Net adjus. & Provi sions * Operating income without trading income 17 3 Quarter 2001 - Consolidated results INVESTOR RELATIONS ‘01 -‘00 Var. Dec. 2000 3Q 2001 Direct funding 10.7 10.9 1.9% Indirect funding 13.9 14.0 0.7% Euro billions Assets under custody 6.9 6.5 -5.9% Assets under management 7.0 7.5 7.1% GP (discretional accs.) 2.6 2.3 -11.5% Mutual funds 3.0 3.6 22.0% Insurance products 1.4 1.6 15.1% TOTAL FINANCIAL ASSETS 24.6 24.9 1.2% 18
