mohdruhaizie_iapophtf
advertisement

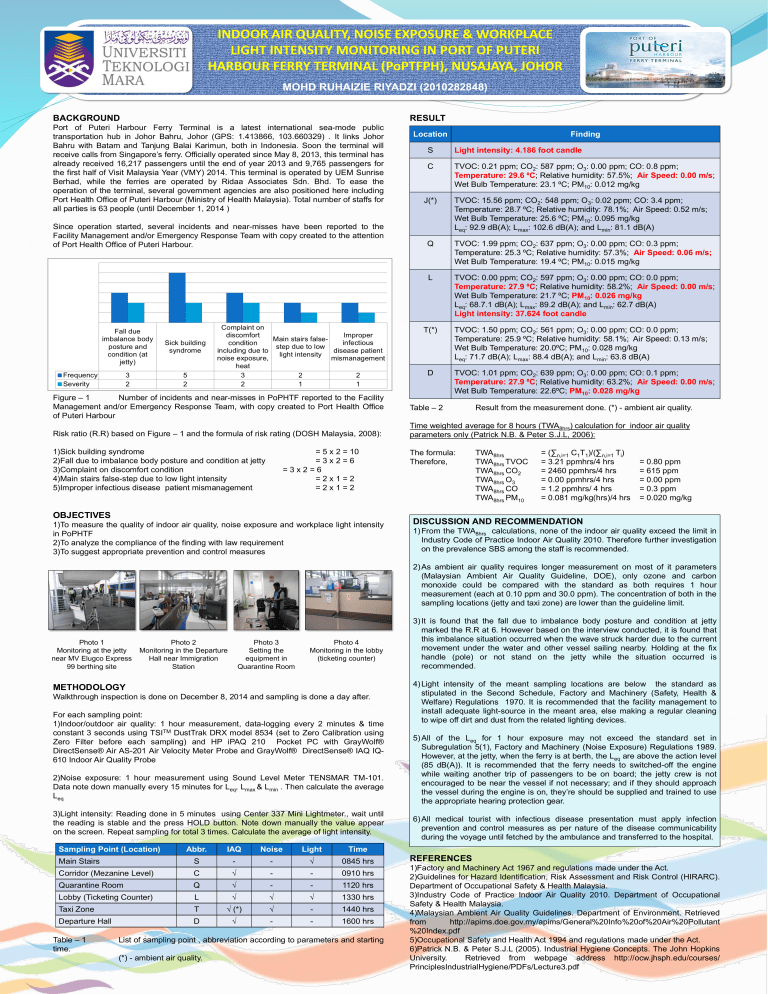
INDOOR AIR QUALITY, NOISE EXPOSURE & WORKPLACE LIGHT INTENSITY MONITORING IN PORT OF PUTERI HARBOUR FERRY TERMINAL (PoPTFPH), NUSAJAYA, JOHOR MOHD RUHAIZIE RIYADZI (2010282848) BACKGROUND RESULT Port of Puteri Harbour Ferry Terminal is a latest international sea-mode public transportation hub in Johor Bahru, Johor (GPS: 1.413866, 103.660329) . It links Johor Bahru with Batam and Tanjung Balai Karimun, both in Indonesia. Soon the terminal will receive calls from Singapore’s ferry. Officially operated since May 8, 2013, this terminal has already received 16,217 passengers until the end of year 2013 and 9,765 passengers for the first half of Visit Malaysia Year (VMY) 2014. This terminal is operated by UEM Sunrise Berhad, while the ferries are operated by Ridaa Associates Sdn. Bhd. To ease the operation of the terminal, several government agencies are also positioned here including Port Health Office of Puteri Harbour (Ministry of Health Malaysia). Total number of staffs for all parties is 63 people (until December 1, 2014 ) Since operation started, several incidents and near-misses have been reported to the Facility Management and/or Emergency Response Team with copy created to the attention of Port Health Office of Puteri Harbour. Location Finding S Light intensity: 4.186 foot candle C TVOC: 0.21 ppm; CO2: 587 ppm; O3: 0.00 ppm; CO: 0.8 ppm; Temperature: 29.6 ⁰C; Relative humidity: 57.5%; Air Speed: 0.00 m/s; Wet Bulb Temperature: 23.1 ⁰C; PM10: 0.012 mg/kg J(*) TVOC: 15.56 ppm; CO2: 548 ppm; O3: 0.02 ppm; CO: 3.4 ppm; Temperature: 28.7 ⁰C; Relative humidity: 78.1%; Air Speed: 0.52 m/s; Wet Bulb Temperature: 25.6 ⁰C; PM10: 0.095 mg/kg Leq: 92.9 dB(A); Lmax: 102.6 dB(A); and Lmin: 81.1 dB(A) Q TVOC: 1.99 ppm; CO2: 637 ppm; O3: 0.00 ppm; CO: 0.3 ppm; Temperature: 25.3 ⁰C; Relative humidity: 57.3%; Air Speed: 0.06 m/s; Wet Bulb Temperature: 19.4 ⁰C; PM10: 0.015 mg/kg L TVOC: 0.00 ppm; CO2: 597 ppm; O3: 0.00 ppm; CO: 0.0 ppm; Temperature: 27.9 ⁰C; Relative humidity: 58.2%; Air Speed: 0.00 m/s; Wet Bulb Temperature: 21.7 ⁰C; PM10: 0.026 mg/kg Leq: 68.7.1 dB(A); Lmax: 89.2 dB(A); and Lmin: 62.7 dB(A) Light intensity: 37.624 foot candle T(*) D TVOC: 1.50 ppm; CO2: 561 ppm; O3: 0.00 ppm; CO: 0.0 ppm; Temperature: 25.9 ⁰C; Relative humidity: 58.1%; Air Speed: 0.13 m/s; Wet Bulb Temperature: 20.0⁰C; PM10: 0.028 mg/kg Leq: 71.7 dB(A); Lmax: 88.4 dB(A); and Lmin: 63.8 dB(A) TVOC: 1.01 ppm; CO2: 639 ppm; O3: 0.00 ppm; CO: 0.1 ppm; Temperature: 27.9 ⁰C; Relative humidity: 63.2%; Air Speed: 0.00 m/s; Wet Bulb Temperature: 22.6⁰C; PM10: 0.028 mg/kg Figure – 1 Number of incidents and near-misses in PoPHTF reported to the Facility Management and/or Emergency Response Team, with copy created to Port Health Office of Puteri Harbour Table – 2 Risk ratio (R.R) based on Figure – 1 and the formula of risk rating (DOSH Malaysia, 2008): Time weighted average for 8 hours (TWA8hrs) calculation for indoor air quality parameters only (Patrick N.B. & Peter S.J.L, 2006): 1)Sick building syndrome 2)Fall due to imbalance body posture and condition at jetty 3)Complaint on discomfort condition 4)Main stairs false-step due to low light intensity 5)Improper infectious disease patient mismanagement = 5 x 2 = 10 =3x2=6 =3x2=6 =2x1=2 =2x1=2 OBJECTIVES 1)To measure the quality of indoor air quality, noise exposure and workplace light intensity in PoPHTF 2)To analyze the compliance of the finding with law requirement 3)To suggest appropriate prevention and control measures The formula: Therefore, Result from the measurement done. (*) - ambient air quality. TWA8hrs TWA8hrs TVOC TWA8hrs CO2 TWA8hrs O3 TWA8hrs CO TWA8hrs PM10 = (∑n,i=1 C1T1)/(∑n,i=1 Ti) = 3.21 ppmhrs/4 hrs = 2460 ppmhrs/4 hrs = 0.00 ppmhrs/4 hrs = 1.2 ppmhrs/ 4 hrs = 0.081 mg/kg(hrs)/4 hrs = 0.80 ppm = 615 ppm = 0.00 ppm = 0.3 ppm = 0.020 mg/kg DISCUSSION AND RECOMMENDATION 1) From the TWA8hrs calculations, none of the indoor air quality exceed the limit in Industry Code of Practice Indoor Air Quality 2010. Therefore further investigation on the prevalence SBS among the staff is recommended. 2) As ambient air quality requires longer measurement on most of it parameters (Malaysian Ambient Air Quality Guideline, DOE), only ozone and carbon monoxide could be compared with the standard as both requires 1 hour measurement (each at 0.10 ppm and 30.0 ppm). The concentration of both in the sampling locations (jetty and taxi zone) are lower than the guideline limit. Photo 1 Monitoring at the jetty near MV Elugco Express 99 berthing site Photo 2 Monitoring in the Departure Hall near Immigration Station Photo 3 Setting the equipment in Quarantine Room Photo 4 Monitoring in the lobby (ticketing counter) METHODOLOGY Walkthrough inspection is done on December 8, 2014 and sampling is done a day after. For each sampling point: 1)Indoor/outdoor air quality: 1 hour measurement, data-logging every 2 minutes & time constant 3 seconds using TSITM DustTrak DRX model 8534 (set to Zero Calibration using Zero Filter before each sampling) and HP iPAQ 210 Pocket PC with GrayWolf® DirectSense® Air AS-201 Air Velocity Meter Probe and GrayWolf® DirectSense® IAQ IQ610 Indoor Air Quality Probe 2)Noise exposure: 1 hour measurement using Sound Level Meter TENSMAR TM-101. Data note down manually every 15 minutes for Leq, Lmax & Lmin . Then calculate the average Leq 3)Light intensity: Reading done in 5 minutes using Center 337 Mini Lightmeter., wait until the reading is stable and the press HOLD button. Note down manually the value appear on the screen. Repeat sampling for total 3 times. Calculate the average of light intensity. Sampling Point (Location) Abbr. IAQ Noise Light Time Main Stairs S - - √ 0845 hrs Corridor (Mezanine Level) C √ - - 0910 hrs Quarantine Room Q √ - - 1120 hrs Lobby (Ticketing Counter) L √ √ √ 1330 hrs Taxi Zone T √ (*) √ - 1440 hrs Departure Hall D √ - - 1600 hrs Table – 1 time. List of sampling point , abbreviation according to parameters and starting (*) - ambient air quality. 3) It is found that the fall due to imbalance body posture and condition at jetty marked the R.R at 6. However based on the interview conducted, it is found that this imbalance situation occurred when the wave struck harder due to the current movement under the water and other vessel sailing nearby. Holding at the fix handle (pole) or not stand on the jetty while the situation occurred is recommended. 4) Light intensity of the meant sampling locations are below the standard as stipulated in the Second Schedule, Factory and Machinery (Safety, Health & Welfare) Regulations 1970. It is recommended that the facility management to install adequate light-source in the meant area, else making a regular cleaning to wipe off dirt and dust from the related lighting devices. 5) All of the Leq for 1 hour exposure may not exceed the standard set in Subregulation 5(1), Factory and Machinery (Noise Exposure) Regulations 1989. However, at the jetty, when the ferry is at berth, the Leq are above the action level (85 dB(A)). It is recommended that the ferry needs to switched-off the engine while waiting another trip of passengers to be on board; the jetty crew is not encouraged to be near the vessel if not necessary; and if they should approach the vessel during the engine is on, they’re should be supplied and trained to use the appropriate hearing protection gear. 6) All medical tourist with infectious disease presentation must apply infection prevention and control measures as per nature of the disease communicability during the voyage until fetched by the ambulance and transferred to the hospital. REFERENCES 1)Factory and Machinery Act 1967 and regulations made under the Act. 2)Guidelines for Hazard Identification, Risk Assessment and Risk Control (HIRARC). Department of Occupational Safety & Health Malaysia. 3)Industry Code of Practice Indoor Air Quality 2010. Department of Occupational Safety & Health Malaysia. 4)Malaysian Ambient Air Quality Guidelines. Department of Environment. Retrieved from http://apims.doe.gov.my/apims/General%20Info%20of%20Air%20Pollutant %20Index.pdf 5)Occupational Safety and Health Act 1994 and regulations made under the Act. 6)Patrick N.B. & Peter S.J.L (2005). Industrial Hygiene Concepts. The John Hopkins University. Retrieved from webpage address http://ocw.jhsph.edu/courses/ PrinciplesIndustrialHygiene/PDFs/Lecture3.pdf


