EXCEEDANCES OF STATE STANDARDS
advertisement
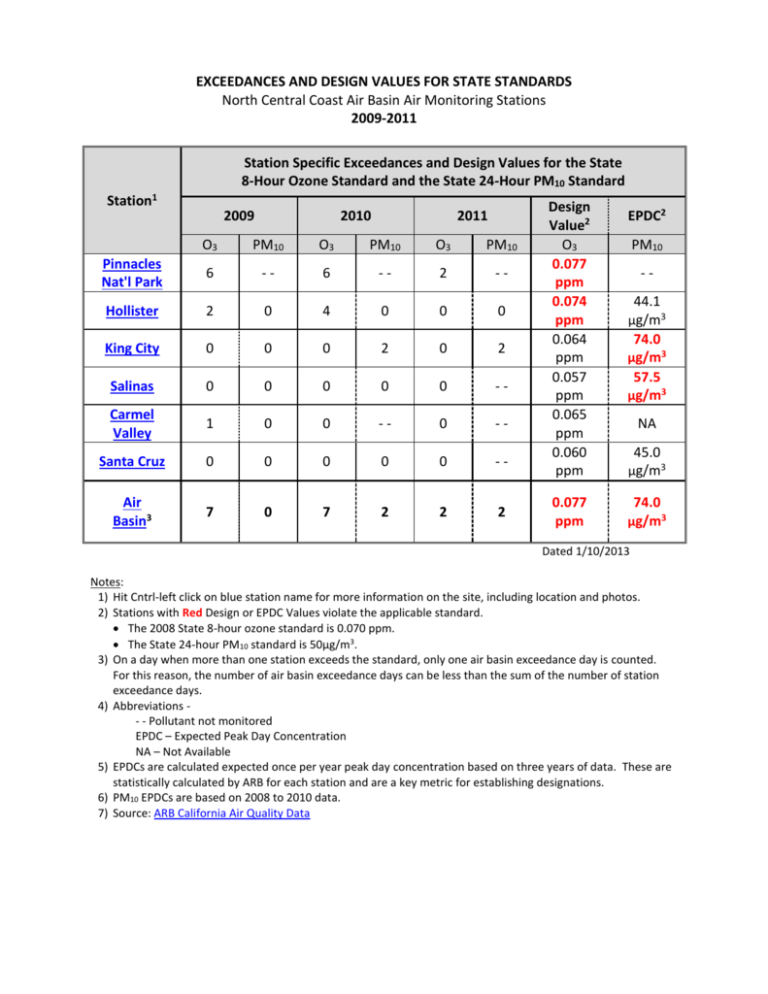
EXCEEDANCES AND DESIGN VALUES FOR STATE STANDARDS North Central Coast Air Basin Air Monitoring Stations 2009-2011 Station Specific Exceedances and Design Values for the State 8-Hour Ozone Standard and the State 24-Hour PM10 Standard Station1 2009 2010 2011 O3 PM10 O3 PM10 O3 PM10 Pinnacles Nat'l Park 6 -- 6 -- 2 -- Hollister 2 0 4 0 0 0 King City 0 0 0 2 0 2 Salinas 0 0 0 0 0 -- Carmel Valley 1 0 0 -- 0 -- Santa Cruz 0 0 0 0 0 -- Air Basin3 7 0 7 2 2 2 Design Value2 O3 0.077 ppm 0.074 ppm 0.064 ppm 0.057 ppm 0.065 ppm 0.060 ppm 0.077 ppm EPDC2 PM10 -44.1 µg/m3 74.0 µg/m3 57.5 µg/m3 NA 45.0 µg/m3 74.0 µg/m3 Dated 1/10/2013 Notes: 1) Hit Cntrl-left click on blue station name for more information on the site, including location and photos. 2) Stations with Red Design or EPDC Values violate the applicable standard. The 2008 State 8-hour ozone standard is 0.070 ppm. The State 24-hour PM10 standard is 50µg/m3. 3) On a day when more than one station exceeds the standard, only one air basin exceedance day is counted. For this reason, the number of air basin exceedance days can be less than the sum of the number of station exceedance days. 4) Abbreviations - - Pollutant not monitored EPDC – Expected Peak Day Concentration NA – Not Available 5) EPDCs are calculated expected once per year peak day concentration based on three years of data. These are statistically calculated by ARB for each station and are a key metric for establishing designations. 6) PM10 EPDCs are based on 2008 to 2010 data. 7) Source: ARB California Air Quality Data
