Introduction to Econometrics
advertisement
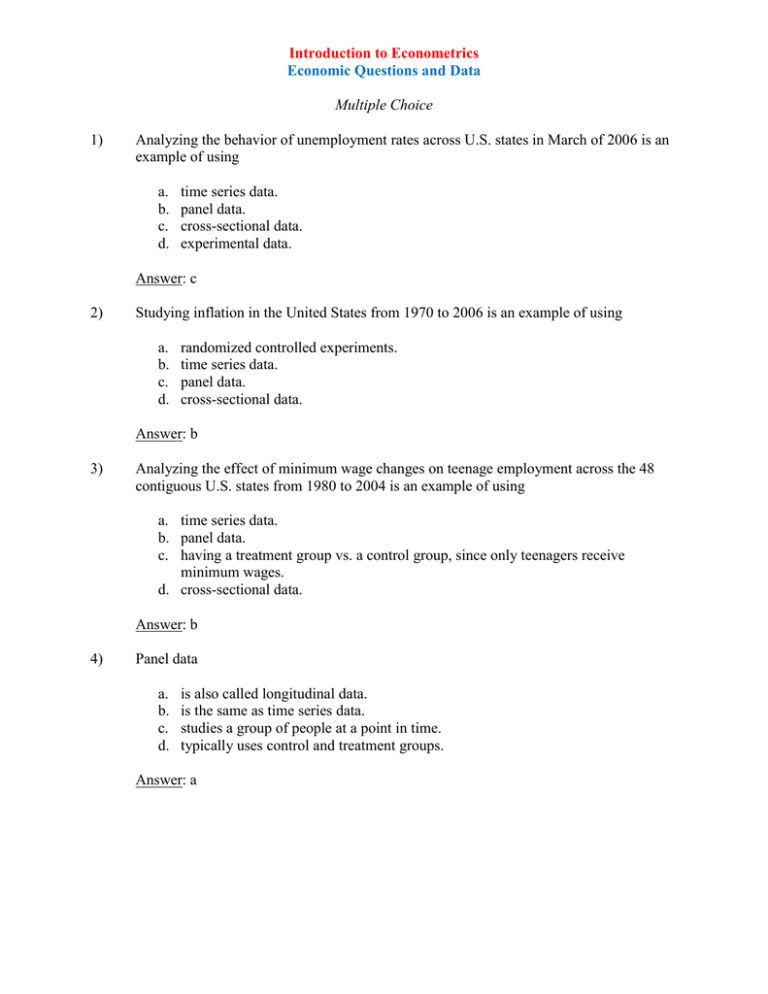
Introduction to Econometrics Economic Questions and Data Multiple Choice 1) Analyzing the behavior of unemployment rates across U.S. states in March of 2006 is an example of using a. b. c. d. time series data. panel data. cross-sectional data. experimental data. Answer: c 2) Studying inflation in the United States from 1970 to 2006 is an example of using a. b. c. d. randomized controlled experiments. time series data. panel data. cross-sectional data. Answer: b 3) Analyzing the effect of minimum wage changes on teenage employment across the 48 contiguous U.S. states from 1980 to 2004 is an example of using a. time series data. b. panel data. c. having a treatment group vs. a control group, since only teenagers receive minimum wages. d. cross-sectional data. Answer: b 4) Panel data a. b. c. d. is also called longitudinal data. is the same as time series data. studies a group of people at a point in time. typically uses control and treatment groups. Answer: a 5) Econometrics can be defined as follows with the exception of a. b. c. d. the science of testing economic theory. fitting mathematical economic models to real-world data. a set of tools used for forecasting future values of economic variables. measuring the height of economists. Answer: d 6) To provide quantitative answers to policy questions a. b. c. d. it is typically sufficient to use common sense. you should interview the policy makers involved. you should examine empirical evidence. is typically impossible since policy questions are not quantifiable. Answer: c 7) An example of a randomized controlled experiment is when a. households receive a tax rebate in one year but not the other. b. one U.S. state increases minimum wages and an adjacent state does not, and employment differences are observed. c. random variables are controlled for by holding constant other factors. d. some 5th graders in a specific elementary school are allowed to use computers at school while others are not, and their end-of-year performance is compared holding constant other factors. Answer: d 8) Ideal randomized controlled experiments in economics are a. b. c. d. often performed in practice. often used by the Federal Reserve to study the effects of monetary policy. useful because they give a definition of a causal effect. sometimes used by universities to determine who graduates in four years rather than five. Answer: c 9) Most economic data are obtained a. b. c. d. through randomized controlled experiments. by calibration methods. through textbook examples typically involving ten observation points. by observing real-world behavior. Answer: d 10) The accompanying graph U.S. Unemployment Rate in % 12 10 8 6 4 2 65 70 75 80 85 90 95 Year is an example of a. b. c. d. experimental data. cross-sectional data. a time series. longitudinal data. Answer: c Essays and Longer Questions 1) Give at least three examples from economics where each of the following type of data can be used: cross-sectional data, time series data, and panel data. Answer: Answers will vary by student. At this level of economics, students most likely have heard of the following use of cross-sectional data: earnings functions, growth equations, the effect of class size reduction on student performance (in this chapter), demand functions (in this chapter: cigarette consumption); time series: the Phillips curve (in this chapter), consumption functions, Okuns’ law; panel data: various U.S. state panel studies on road fatalities (in this book), unemployment rate and unemployment benefits variations, growth regressions (across states and countries), and crime and abortion (Freakonomics).
