FedEx ratios - BUS632
advertisement
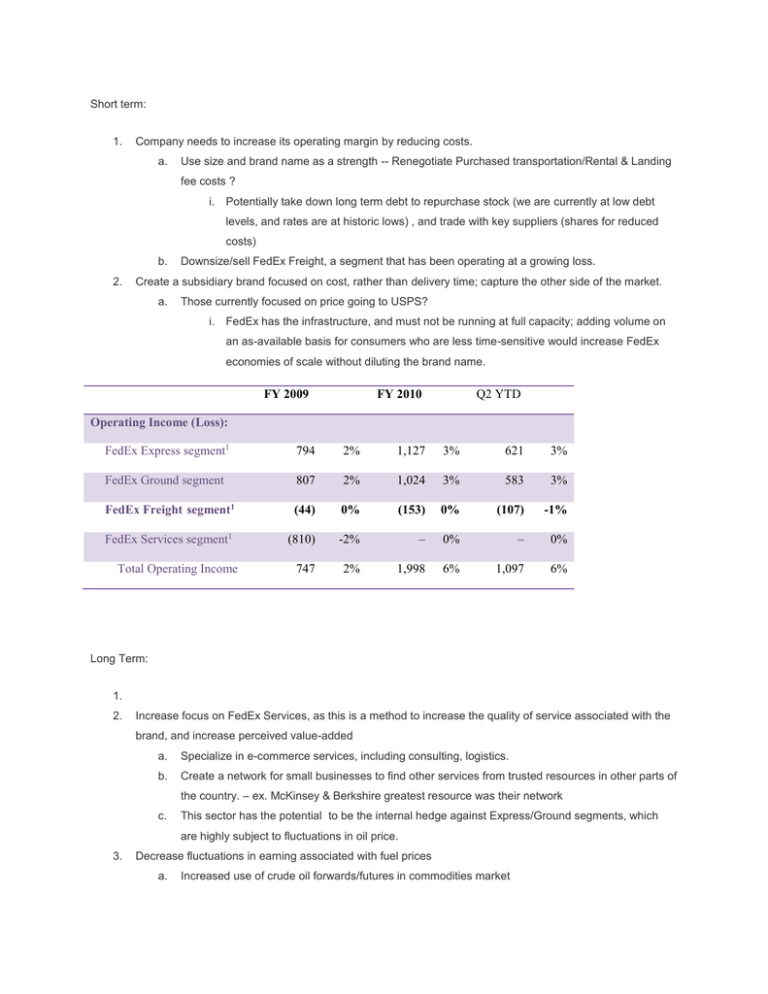
Short term: 1. Company needs to increase its operating margin by reducing costs. a. Use size and brand name as a strength -- Renegotiate Purchased transportation/Rental & Landing fee costs ? i. Potentially take down long term debt to repurchase stock (we are currently at low debt levels, and rates are at historic lows) , and trade with key suppliers (shares for reduced costs) b. 2. Downsize/sell FedEx Freight, a segment that has been operating at a growing loss. Create a subsidiary brand focused on cost, rather than delivery time; capture the other side of the market. a. Those currently focused on price going to USPS? i. FedEx has the infrastructure, and must not be running at full capacity; adding volume on an as-available basis for consumers who are less time-sensitive would increase FedEx economies of scale without diluting the brand name. FY 2009 Q2 YTD FY 2010 Operating Income (Loss): FedEx Express segment1 794 2% 1,127 3% 621 3% FedEx Ground segment 807 2% 1,024 3% 583 3% FedEx Freight segment1 (44) 0% (153) 0% (107) -1% FedEx Services segment1 (810) -2% – 0% – 0% 747 2% 1,998 6% 1,097 6% Total Operating Income Long Term: 1. 2. Increase focus on FedEx Services, as this is a method to increase the quality of service associated with the brand, and increase perceived value-added a. Specialize in e-commerce services, including consulting, logistics. b. Create a network for small businesses to find other services from trusted resources in other parts of the country. – ex. McKinsey & Berkshire greatest resource was their network c. This sector has the potential to be the internal hedge against Express/Ground segments, which are highly subject to fluctuations in oil price. 3. Decrease fluctuations in earning associated with fuel prices a. Increased use of crude oil forwards/futures in commodities market b. Increased use of energy efficient vehicles, as well as commercial solar panels on large facilities (sell energy back to offset costs) FY 2009 FY 2010 Q2 YTD Operating Income (Loss): FedEx Express segment1 794 2% 1,127 3% 621 3% FedEx Ground segment 807 2% 1,024 3% 583 3% FedEx Freight segment1 (44) 0% (153) 0% (107) -1% FedEx Services segment1 (810) -2% – 0% – 0% Total Operating Income 747 2% 1,998 6% 1,097 6% FY 2009 FY 2010 Q2 YTD Operating Expenses: Salaries and employee benefits Purchased transportation2 13,767 39% 14,027 40% 7,582 40% 4,534 13% 4,728 14% 2,717 14% Rentals and landing fees 2,429 7% 2,359 7% 1,229 6% Depreciation and amortization Fuel2 1,975 6% 1,958 6% 981 5% 3,811 11% 3,106 9% 1,825 10% Maintenance and repairs 1,898 5% 1,715 5% 990 5% Impairment and other charges1 Other 1,204 3% 18 0% 67 0% 5,132 14% 4,825 14% 2,601 14% 34,750 98% 32,736 94% 17,992 94% Total Operating Expenses FedEx Ratio Analysis Industry: Air Delivery & Freight Services Growth Rates % FedEx Industry S&P 500 Sales (Qtr vs year ago qtr) 12.10 11.40 11.70 Net Income (YTD vs YTD) 25.70 46.30 54.60 Net Income (Qtr vs year ago qtr) -18.30 28.90 72.30 Sales (5-Year Annual Avg.) 3.42 4.30 7.69 Net Income (5-Year Annual Avg.) -3.99 0.27 7.76 Dividends (5-Year Annual Avg.) 8.70 10.28 4.77 FedEx Industry S&P 500 Gross Margin 25.1 24.6 38.1 Pre-Tax Margin 5.6 9.2 17.0 Net Profit Margin 3.6 5.8 12.4 5Yr Gross Margin (5-Year Avg.) 26.7 25.9 37.8 5Yr PreTax Margin (5-Year Avg.) 6.1 7.9 15.3 5Yr Net Profit Margin (5-Year Avg.) 3.5 4.8 10.9 Profit Margins % Financial Condition FedEx Industry S&P 500 Debt/Equity Ratio 0.13 0.81 1.05 Current Ratio 1.5 1.9 1.4 Quick Ratio 1.4 0.4 0.9 Interest Coverage 28.0 16.4 51.9 Leverage Ratio 1.8 3.1 2.4 46.23 16.62 24.69 Book Value/Share Investment Returns % FedEx Industry S&P 500 Return On Equity 9.2 32.9 22.4 Return On Assets 5.2 10.5 8.0 Return On Capital 6.3 14.0 10.4 Return On Equity (5-Year Avg.) 9.7 21.3 19.2 Return On Assets (5-Year Avg.) 5.2 8.8 7.5 Return On Capital (5-Year Avg.) 6.6 12.2 10.0 Management Efficiency FedEx Industry S&P 500 Income/Employee 14,204 15,838 106,338 Revenue/Employee 400,194 336,166 953,938 Receivable Turnover 9.2 8.7 14.0 Inventory Turnover 70.5 88.5 12.0 Asset Turnover 1.5 1.9 0.8 FY (05/11) FY (05/10) FY (05/09) 1st Qtr $1.21 $0.58 $1.23 2nd Qtr $0.89 $1.11 $1.59 3rd Qtr NA $0.77 $0.31 4th Qtr NA $1.32 -$2.82 $2.10 $3.78 $0.31 Total REVENUE - QUARTERLY RESULTS (IN MILLIONS) FY (05/11) FY (05/10) FY (05/09) 1st Qtr 9,457.0 8,009.0 9,970.0 2nd Qtr 9,632.0 8,596.0 9,538.0 3rd Qtr NA 8,701.0 8,137.0 4th Qtr NA 9,428.0 7,852.0 19,089.0 34,734.0 35,497.0 Total OWNERSHIP INFORMATION Shares Outstanding 315.00 Mil Institutional Ownership (%) 76.59 Top 10 Institutions (%) 34.80 Mutual Fund Ownership (%) .67 5%/Insider Ownership (%) 3.25 Float (%) 96.76 EARNINGS PER SHARE - QUARTERLY RESULTS http://moneycentral.msn.com/investor/invsub/results/compare.asp?symbol=FDX
