Healy, Chapter 8-9
advertisement
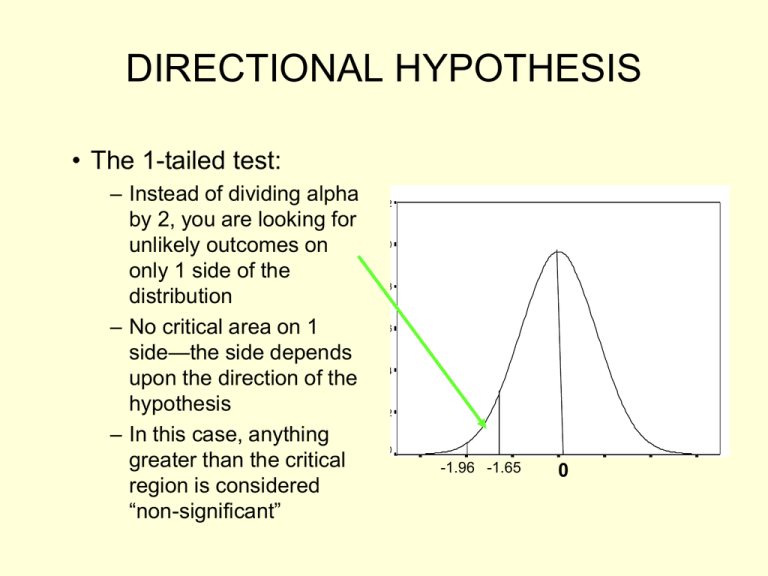
DIRECTIONAL HYPOTHESIS • The 1-tailed test: – Instead of dividing alpha by 2, you are looking for unlikely outcomes on only 1 side of the distribution – No critical area on 1 side—the side depends upon the direction of the hypothesis – In this case, anything greater than the critical region is considered “non-significant” 1.2 1.0 .8 .6 .4 .2 0.0 -2.07 -1.21 -.36 -1.96 -1.65 .50 0 1.36 Normal Curve, Mean = .5, SD = .7 2.21 3.07 Non-Directional & Directional Hypotheses • Nondirectional – Ho: there is no effect: (X = µ) – H1: there IS an effect: (X ≠ µ) – APPLY 2-TAILED TEST • 2.5% chance of error in each tail -1.96 1.96 • Directional – H1: sample mean is larger than population mean (X > µ) – Ho x ≤ µ – APPLY 1-TAILED TEST • 5% chance of error in one tail 1.65 Why we typically use 2-tailed tests • Often times, theory or logic does allow us to prediction direction – why not use 1tailed tests? • Those with low self-control should be more likely to engage in crime. • Rehabilitation programs should reduce likelihood of future arrest. • What happens if we find the reverse? – Theory is incorrect, or program has the unintended consequence of making matters worse. STUDENT’S t DISTRIBUTION – We can’t use Z distribution with smaller samples (N<100) because of large standard errors – Instead, we use the t distribution: – Approximately normal beginning when sample size > 30 – Probabilities under the t distribution are different than from the Z distribution for small samples – They become more like Z as sample size (N) increases THE 1-SAMPLE CASE – 2 Applications • Single sample means (large N’s) (Z statistic) – May substitute sample s for population standard deviation, but then subtract 1 from n » s/√N-1 on bottom of z formula • Smaller N distribution (t statistic), population SD unknown STUDENT’S t DISTRIBUTION – Find the t (critical) values in App. B of Healey – “degrees of freedom” • # of values in a distribution that are free to vary • Here, df = N-1 – When finding t(critical) always use lower df associated with your N Practice: ALPHA .05 .01 .10 .05 TEST 2-tailed 1-tailed 2-tailed 1-tailed N 57 25 32 15 t(Critical) Example: Single sample means, smaller N and/or unknown pop. S.D. 1. A random sample of 26 sociology grads scored an average of 458 on the GRE sociology test, with a standard deviation of 20. Is this significantly higher than the national average (µ = 440)? 2. The same students studied an average of 19 hours a week (s=6.5). Is this significantly different from the overall average (µ = 15.5)? • USE ALPHA = .05 for both 1-Sample Hypothesis Testing (Review of what has been covered so far) 1. If the null hypothesis is correct, the estimated sample statistic (i.e., sample mean) is going to be close to the population mean 2. When we “set the criteria for a decision”, we are deciding how far the sample statistic has to fall from the population mean for us to decide to reject H0 – Deciding on probability of getting a given sample statistic if H0 is true 3 common probabilities (alpha levels) used are .10, .05 & .01 – • These correspond to Z score critical values of 1.65, 1.96 & 258 1-Sample Hypothesis Testing (Review of what has been covered so far) 3. If test statistic we calculate is beyond the critical value (in the critical region) then we reject H0 – Probability of getting test stat (if null is true) is small enough for us to reject the null – In other words: “There is a statistically significant difference between population & sample means.” 4. If test statistic we calculate does not fall in critical region, we fail to reject the H0 – “There is NOT a statistically significant difference…” 2-Sample Hypothesis Testing (intro) – Apply when… • You have a hypothesis that the means (or proportions) of a variable differ between 2 populations – Components – 2 representative samples – Don’t get confused here (usually both come from same “sample”) – One interval/ratio dependent variable – Examples » Do male and female differ in their aggression (# aggressive acts in past week)? » Is there a difference between MN & WI in the proportion who eat cheese every day? – Null Hypothesis (Ho) • The 2 pops. are not different in terms of the dependent variable 2-SAMPLE HYPOTHESIS TESTING • Assumptions: – Random (probability) sampling – Groups are independent – Homogeneity of variance » the amount of variability in the D.V. is about equal in each of the 2 groups – The sampling distribution of the difference between means is normal in shape 2-SAMPLE HYPOTHESIS TESTING • We rarely know population S.D.s – Therefore, for 2-sample t-testing, we must use 2 sample S.D.s, corrected for bias: » “Pooled Estimate” • Focus on the t statistic: t (obtained) = (X – X) σ x-x • we’re finding the difference between the two means… …and standardizing this difference with the pooled estimate 2-SAMPLE HYPOTHESIS TESTING 2-Sample Sampling Distribution – difference between sample means (closer sample means will have differences closer to 0) • t-test for the difference between 2 sample means: • Addresses the question of whether the observed difference between the sample means reflects a real difference in the population means or is due to sampling error -2.042 0 2.042 ASSUMING THE NULL! Applying the 2-Sample t Formula – Example: • Research Hypothesis (H1): – Soc. majors at UMD drink more beers per month than non-soc. majors – Random sample of 205 students: » Soc majors: N = 100, mean=16, s=1.0 » Non soc. majors: N = 105, mean=15, s=0.9 » Alpha = .01 » FORMULA: t(obtained) = X1 – X2 pooled estimate Answers • Null hypothesis: – “There is no difference in mean number of fights between inmates with tattoos and inmates without tattoos.” • Use a 1 or 2-tailed test? – One-tailed test because the theory predicts that inmates with tattoos will get into MORE fights. Answers • Calculations – Obtained value • Reject the null? – Yes because the t(obtained) (19.09) is greater than the t(critical, one-tail, df=398) (1.658) • This t value indicates there are 19.09 standard error units that separate the two mean values – VERY unlikely we got this big a difference due to sampling error • Research hypothesis restated as non-directional: – “There is a difference in the mean number of fights reported by inmates with tattoos and inmates without tattoos.” • Would you come to a different conclusion if you used a 2-tailed test? – No, because 19.09 is still well beyond the 2-tailed critical value (1.980). 2-Sample Hypothesis Testing in SPSS • Independent Samples t Test Output: – Testing the Ho that there is no difference in number of adult arrests between a sample of individuals who were abused/neglected as children and a matched control group. Group Statistics SUB_CNLX SUBJECT / CONTROL ADULT_S NUMBER 1 Subjects OF ADULT OFFENSES 2 Controls N 397 192 Std. Error Mean Std. Deviation Mean 9.24 13.821 .694 4.43 7.002 .505 Interpreting SPSS Output • Difference in mean # of adult arrests between those who were abused as children & control group Independent Samples Test Levene's Test for Equality of Variances F ADULT_S NUMBER Equal variances OF ADULT OFFENSES assumed Equal variances not assumed 36.864 Sig. .000 t-test for Equality of Means t df Sig. (2-tailed) Mean Difference Std. Error Difference 95% Confidence Interval of the Difference Lower Upper 4.547 587 .000 4.81 1.058 2.732 6.887 5.604 585.783 .000 4.81 .858 3.124 6.495 Interpreting SPSS Output • t statistic, with degrees of freedom Independent Samples Test Levene's Test for Equality of Variances F ADULT_S NUMBER Equal variances OF ADULT OFFENSES assumed Equal variances not assumed 36.864 Sig. .000 t-test for Equality of Means t df Sig. (2-tailed) Mean Difference Std. Error Difference 95% Confidence Interval of the Difference Lower Upper 4.547 587 .000 4.81 1.058 2.732 6.887 5.604 585.783 .000 4.81 .858 3.124 6.495 Interpreting SPSS Output • “Sig. (2 tailed)” – gives the actual probability of making a Type I (alpha) error • a.k.a. the “p value” – p = probability Independent Samples Test Levene's Test for Equality of Variances F ADULT_S NUMBER Equal variances OF ADULT OFFENSES assumed Equal variances not assumed 36.864 Sig. .000 t-test for Equality of Means t df Sig. (2-tailed) Mean Difference Std. Error Difference 95% Confidence Interval of the Difference Lower Upper 4.547 587 .000 4.81 1.058 2.732 6.887 5.604 585.783 .000 4.81 .858 3.124 6.495 “Sig.” & Probability • Number under “Sig.” column is the exact probability of obtaining that t-value (finding that mean difference) if the null is true – When probability > alpha, we do NOT reject H0 – When probability < alpha, we DO reject H0 • As the test statistics (here, “t”) increase, they indicate larger differences between our obtained finding and what is expected under null – Therefore, as the test statistic increases, the probability associated with it decreases Example 2: Education & Age at which First Child is Born H0: There is no relationship between whether an individual has a college degree and his or her age when their first child is born. Group Statistics AGEKDBRN R'S AGE WHEN 1ST CHILD BORN COLDGREE R has 4-year college degree 1.00 No -- less than a Bachelor's degree 2.00 Yes -- a Bachelor's or Graduate degree N Mean Std. Deviation Std. Error Mean 812 22.74 4.826 .169 222 26.82 5.343 .359 Independent Samples Test Levene's Test for Equality of Variances F AGEKDBRN R'S AGE Equal variances WHEN 1ST CHILD BORN assumed Equal variances not assumed 4.547 Sig. .033 t-test for Equality of Means t df Sig. (2-tailed) Mean Difference Std. Error Difference 95% Confidence Interval of the Difference Lower Upper -10.926 1032 .000 -4.09 .374 -4.824 -3.355 -10.310 326.163 .000 -4.09 .397 -4.869 -3.309 Education & Age at which First Child is Born 1. What is the mean difference in age? 2. What is the probability that this t statistic is due to sampling error? 3. Do we reject H0 at the alpha = .05 level? 4. Do we reject H0 at the alpha = .01 level? Independent Samples Test Levene's Test for Equality of Variances F AGEKDBRN R'S AGE Equal variances WHEN 1ST CHILD BORN assumed Equal variances not assumed 4.547 Sig. .033 t-test for Equality of Means t df Sig. (2-tailed) Mean Difference Std. Error Difference 95% Confidence Interval of the Difference Lower Upper -10.926 1032 .000 -4.09 .374 -4.824 -3.355 -10.310 326.163 .000 -4.09 .397 -4.869 -3.309
