Econ 102- Introductıon to economıcs I Department of Economıcs
advertisement
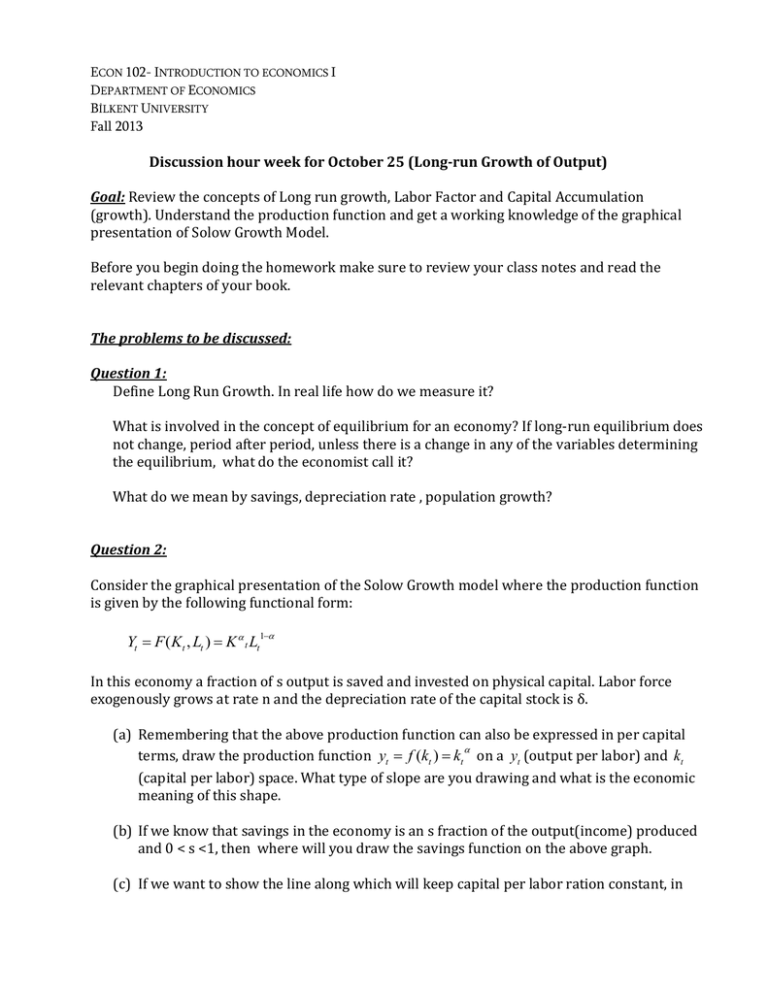
ECON 102- INTRODUCTION TO ECONOMICS I DEPARTMENT OF ECONOMICS BİLKENT UNIVERSITY Fall 2013 Discussion hour week for October 25 (Long-run Growth of Output) Goal: Review the concepts of Long run growth, Labor Factor and Capital Accumulation (growth). Understand the production function and get a working knowledge of the graphical presentation of Solow Growth Model. Before you begin doing the homework make sure to review your class notes and read the relevant chapters of your book. The problems to be discussed: Question 1: Define Long Run Growth. In real life how do we measure it? What is involved in the concept of equilibrium for an economy? If long-run equilibrium does not change, period after period, unless there is a change in any of the variables determining the equilibrium, what do the economist call it? What do we mean by savings, depreciation rate , population growth? Question 2: Consider the graphical presentation of the Solow Growth model where the production function is given by the following functional form: Yt F ( Kt , Lt ) K t Lt 1 In this economy a fraction of s output is saved and invested on physical capital. Labor force exogenously grows at rate n and the depreciation rate of the capital stock is δ. (a) Remembering that the above production function can also be expressed in per capital terms, draw the production function yt f (kt ) kt on a yt (output per labor) and kt (capital per labor) space. What type of slope are you drawing and what is the economic meaning of this shape. (b) If we know that savings in the economy is an s fraction of the output(income) produced and 0 < s <1, then where will you draw the savings function on the above graph. (c) If we want to show the line along which will keep capital per labor ration constant, in other words it compensates an amount of capital equal to the total of depreciated part of the capital stock and growth rate of labor i.e. n the line will have to be equal to ( n)kt . Draw this line on the same graph. (d) What is the equilibrium condition that will keep the kt ratio constant period after period? (In other words the point where the savings, hence investment, is equal to the additional capital stock necessary that will keep the capital per labor ratio, kt constant). Show the amount of kt for that equality between savings and ( n)kt . (e) What is the output produced at that level of kt . What is the property of this long-run equilibrium level of output per labor (this is also output per person since labor and population is assumed to the same in Solow model assumptions) in the economy? Question 3: (a) In the above Solow model what happens to the graph if the population growth n increases in an economy? Show the change in the line(s) and show the new equilibrium. Can you think about an explanation of how the additional labor leads to a decline in the output per labor. (b) In the above Solow model, how does the equilibrium long-run output per labor change if s i.e. savings ratio increases. Which line in the graph will change and how will the long-run equilibrium of output per labor change. Can you give an economic description to the events taking place for this change.
