risk management
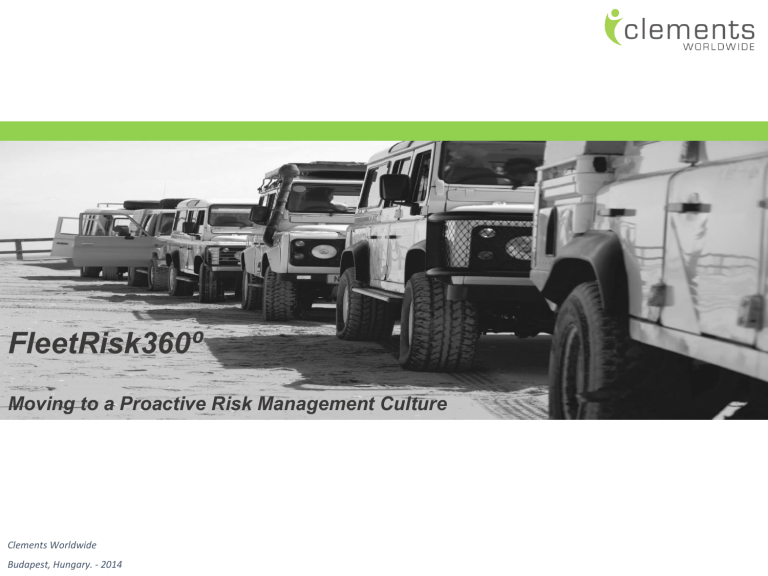
FleetRisk360 ⁰
Moving to a Proactive Risk Management Culture
Clements Worldwide
Budapest, Hungary. - 2014
ABOUT CLEMENTS
Clements Worldwide is a full-spectrum insurance and risk management firm specialized in risk mitigation and solutions of global scope.
Founded in 1947, our solutions are specifically designed to meet the needs of individuals and firms living and operating outside of their home country, regardless of nationality or destination.
Company Accomplishments:
Created the first expatriate insurance program in 1947
Preferred insurer of U.S. Foreign Service Officers worldwide
Insures 5 out of every 6 embassy associations
Largest provider of insurance solutions to the international school community
Largest provider of insurance solutions to the aid and development sector
Provides coverage in over 180 countries
6 time consecutive Best Practices award recipient
Multi-line underwriting authority with Lloyds of
London
2
SURVEY METHODOLOGY
An insured claim is no more a sign of risk management than incarceration is a sign of crime fighting.
Risk
Management
Financial
Resilience
Organizational
Information
FleetRisk360°
Fleet Operation
Fleet
Composition
Enterprise Risk Management
Followed a holistic enterprise risk management approach.
Surveyed bellwether organizations o UN Fleets o Aid and development organizations of varying sizes.
25% response rate among those surveyed.
Leveraged Clements’ existing fleet customers in more than 170 countries.
3
EXECUTIVE SUMMARY
MISSION CRITICAL
RISK MANAGEMENT
FINANCIAL RESILIENCE
RISK CONCENTRATION
• 70% of survey respondents indicate that the fleet is mission critical, therefore fleet risks need to be managed with greater care and professionalism.
• 58% of survey respondents indicate that risk management capabilities, structure and accountabilities needs to be overhauled in addition to a generally punitive risk culture.
• The total cost of ownership (TCO) is not transparent –
58% of respondents indicate postponing necessary fleet investments and 58% have no reserve funds, yet 55% indicate high financial resilience.
• 78% of respondents indicate that their organizations do not have policies in place regarding concentration of risk, exposing fleets to tail / catastrophic losses.
REPUTATION RISK
• Reputation risk is acknowledged as the highest impact event with the highest likelihood.
4
ORGANIZATIONAL INFORMATION
Key Findings
The organizations surveyed have a special duty of care and thus an enhanced risk and reputational exposure given their line of work.
70% of survey respondents indicate that the fleet is mission critical, therefore fleet risks need to be managed with greater care and professionalism.
75% of survey respondents are headquartered in North America or Europe exacerbating reputation, currency and long-tail exposures.
83% of respondents do not have centralized control over fleet management, leading to diffuse accountability and lowered organizational oversight.
5
ORGANIZATIONAL INFORMATION
Organization’s Mission
Fleet Importance
0 (Not Important)
0%
1
5%
2
0%
3
26%
4
16%
5 (Mission
Critical)
53%
6
ORGANIZATIONAL INFORMATION
HQ Location
4,8%
4,8% 4,8%
14,3%
9,5%
61,9%
Asia
Europe
MENA
North America
Central America/Caribbean South America
Australia/Oceania Sub-Saharan Africa
With the majority of surveyed headquarters in highly litigious countries, long-tail liability exposures remain a concern – albeit remote.
The expectation that comparative duty of care will be met across regions is enhanced for firms operating from the U.S. and Europe.
Increasing case examples of extreme vicarious
liability underscore this emerging class of risk.
7
FLEET COMPOSITON
Key Findings
54% of the fleet is comprised of soft bodied SUVs and double cabin pickups.
Despite nascent attempts at leasing and rental alternatives, outright vehicle ownership remains commonplace therefore physical damage exposures remain on the balance sheet.
59% of the fleets surveyed are based in Sub-Saharan Africa with DRC, South Sudan, Kenya,
Ethiopia, Uganda, among others, comprising high concentrations.
A general fleet manager bias is evident throughout the survey and conflicts with prior research.
8
Privileged & Confidential
FLEET COMPOSITON
Fleet Adequacy
Fleet Size
Vehicle Type
1
(Needs are not met)
0%
0%
2
8%
25%
3
(Needs are met)
4 5
(Needs are exceeded)
75%
50%
8%
8%
8%
8%
Large scale fleet right sizing contradicts the response on fleet adequacy in meeting transport needs.
Global Fleet Reliability
1
(100% Downtime)
0%
2
0%
3
27%
4
64%
5
(100% Uptime)
9%
The vicious cycle of overutilizing new vehicles and under-utilizing older vehicles challenges this assertion.
Fleet Condition
1 (Poor) 2
0% 23%
3
31%
4
46%
5
(Excellent)
0%
Large vehicle “graveyards” run counter to this survey response.
9
Privileged & Confidential
FLEET COMPOSITON
Vehicle Location
59%
Asia
Europe
C. America/Caribbean
Australia/Oceania
12%
15%
There is a risk management “tension” in being domiciled in N.A. and Europe, while principally operating in Sub-Saharan Africa and developing countries.
6%
Many of these countries have under-developed and under-capitalized insurance pools, where many forms of local insurance are more akin with taxation than coverage.
2%
6%
0,2%
Currency volatility, low liability limits and highly restrictive coverage territories greatly hinder fleet operations.
MENA
N. America
S. America
Sub-Saharan Africa
10
Privileged & Confidential
FLEET OPERATION
Key Findings
Throughout the survey, a well-trained driver fallacy is evident in survey responses.
o “We only hire trained drivers.” o “We train drivers… o …however infrequently.”
Fleet management software is coming of age, however archaic paper-based approaches remain entrenched.
76% of respondents allow for liberal personal access to vehicles and third-party transportation increasing the potential for third party / first party losses.
o 54% allow third-party transportation without requiring waivers.
The fleet lifecycle standard of 5 years and 150,000 kms disposal criteria for soft-bodied vehicles remains aspirational.
11
Privileged & Confidential
FLEET OPERATION
Driver Training Frequency
Other
Only induction training
Bi-annually
Annually
Semi-annually
Quarterly
Monthly
0,0%
The best “safety device” is a well-trained driver!
20,0% 40,0% 60,0% 80,0%
Vehicles Transport Third-Parties
No; 15,4%
Vehicles Allowed for Personal Use
23,1%
Unknown;
7,7%
Yes; 76,9%
Yes No Unknown
76,9%
12
Privileged & Confidential
FINANCIAL RESILIENCE
Key Findings
Given the funding source (“tied aid”) and duty exemption applying to more than 60% of respondents, greater accountability is placed on standards of fleet practice.
70% of respondents indicate vehicles are held on their balance sheets and are depreciated – indicating greater adoption of GARP/IFRS standards – a rudimentary form of fleet management.
The total cost of ownership (TCO) is not transparent – 58% of respondents indicate postponing necessary fleet investments and 58% have no reserve funds, yet 55% indicate high financial resilience.
13
Privileged & Confidential
FINANCIAL RESILIENCE
Financial Resilience
1 (Weak)
11%
2
11%
3
22%
4
11%
5 (Strong)
44%
Necessary Fleet Investments
Postponed in the last 5 years
8,3%
33,3%
Privileged & Confidential
Yes No Unknown
58,3%
Are funds set aside for unexpected fleet expenditures?
58,3%
33,3%
Yes No
8,3%
Unknown
14
RISK MANAGEMENT
Key Findings
58% of survey respondents indicate that risk management capabilities, structure and accountabilities needs to be overhauled.
Punitive culture precludes proactive loss reporting and diminishes risk management transparency.
78% of respondents indicate that their organizations do not have policies in place regarding concentration of risk, exposing fleets to tail / catastrophic losses.
15
Privileged & Confidential
RISK MANAGEMENT
Organization's Risk Management Capabilities
1 (Weak) 2 3 4
33% 25% 25% 8%
5 (Strong)
8%
Punitive Risk Culture
“Some staff are not reporting accidents / incidents in fear of the $500 charge imposed by the agency; hence they end up trying to repair the damage unnoticed, hence we cannot track the number of accidents for a certain period of time.”
Privileged & Confidential
16
RISK MANAGEMENT
Policy Regarding Concentration of Risk
7,7%
15,4%
Yes No Unknown
76,9%
The absence of a policy on the concentration of vehicles and values exposes respondents to catastrophic losses.
This is compounded by the limited ‘fiscal discipline’ in that reserve funds are either difficult to maintain or not maintained at all.
This is further exacerbated by the reality that donor funds are usually “tied” to specific projects and not allocated to overhead.
17
Privileged & Confidential
RISK MANAGEMENT
Respondent Perception
Reputation Risk
Driver/Passenger Fatality
Terrorism
War
Theft
3 rd Party Fatality
Driver/Passenger Injury
Mechanical Failure
3 rd Party Injury
Riots
Fire
Expropriation
Acts of Nature
3 rd Party Property Damage
High
Physical Losses
Reputation / Liability Exposures
Low Medium
Likelihood
Collision
Physical Damage
Wear & Tear
18
RISK MANAGEMENT
Trend Adjusted
Reputation Risk
Acts of Nature
War
Expropriation
Terrorism
Riots
Theft
3 rd Party Fatality
Driver/Passenger Fatality
Driver/Passenger Injury
3 rd Party Injury
3 rd Party Property Damage
Fire
Mechanical Failure
Collision
Physical Damage
High
Wear & Tear
Physical Losses
Reputation / Liability Exposures
Low Medium
Likelihood
19
RISK MANAGEMENT
Fragile Domain
Risk Priority = Mitigate / Optimize
Robust Domain
Risk Priority = Transfer
Antifragile Domain
Risk Priority = Survival
Expected Losses Unexpected Losses Catastrophic Losses
20
1D = Vertical, top-down structure, creates ‘placebo’ effect that risks are being managed, risk managers are isolated and part of the “business prevention” team. This framework is typical of financial firms.
Risk management is mostly quantitative.
2 nd Dimension
3D = Diagonal hybrid structure borrows from flat manufacturing process risk management, but filters signal to noise ratio – RMs embedded at all organizational levels as part of decision making framework, not prevention framework. Risk management is 50:50.
2D = Horizontal structure mirroring assembly line ‘defects’ management.
Typically seen in the manufacturing context – the entire line is empowered to halt the system. The signal to noise ratio is a potential downside.
May lead to
“McCarthyism” and false positives. Risk management is mostly qualitative.
21
RISK MANAGEMENT
Risk Transfer / Discovery Period: Claims paid by Clements on a 1 st dollar basis – fleet operator serves as “reinsurer.”
Risk Retention / Operational Period: Claims paid by fleet operator on a 1 st dollar basis – Clements serves as reinsurance and claims administrator under an SLA.
Critical Milestones:
0-12 Months –
> Validate fleet data and retention amounts.
> Determine loss ratio, causes of loss.
> Reserve establishment.
12-24 Months –
> Modify risk sharing model.
> Competency building and reserve establishment.
> Preparedness for “risk swap.”
24 – 36 Months –
> Clements migrates to reinsurance.
> Fleet operator covers claims on a 1 st dollar basis.
> SLA claims management service creates efficiencies.
36 – 60 Months –
> Increase fleet operator retention of risk.
> Implement reinsurance model for catastrophic losses.
> Adjustment of contribution per vehicle based on actual loss projections.
22
NEXT STEPS
Full survey findings to be made available to Fleet Forum members and the community writ large.
A risk management primer is under development that will highlight enterprise risk management lessons, risk domains and mitigation strategies.
Clements is committed to working with Fleet Forum in developing solutions across the spectrum of fleet sizes.
23
CLEMENTS WORLDWIDE
Clements Worldwide
One Thomas Circle NW
8 th Floor
Washington DC 20005
Washington D.C. | London U.K. | Dubai U.A.E
23
![[STORY ARCHIVES IMAGE]](http://s3.studylib.net/store/data/007416224_1-64c2a7011f134ef436c8487d1d0c1ae2-300x300.png)
