Using colorimetry to determine a rate equation – Data Analysis Only
advertisement
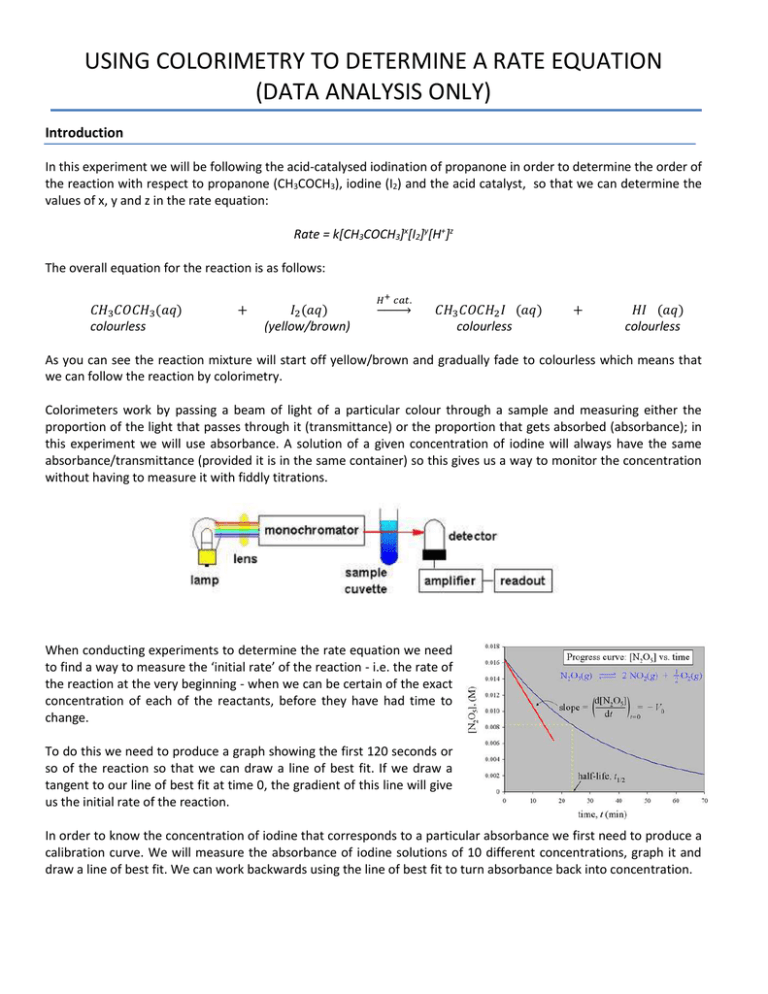
USING COLORIMETRY TO DETERMINE A RATE EQUATION (DATA ANALYSIS ONLY) Introduction In this experiment we will be following the acid-catalysed iodination of propanone in order to determine the order of the reaction with respect to propanone (CH3COCH3), iodine (I2) and the acid catalyst, so that we can determine the values of x, y and z in the rate equation: Rate = k[CH3COCH3]x[I2]y[H+]z The overall equation for the reaction is as follows: 𝐶𝐻3 𝐶𝑂𝐶𝐻3 (𝑎𝑞) colourless + 𝐼2 (𝑎𝑞) (yellow/brown) 𝐻 + 𝑐𝑎𝑡. → 𝐶𝐻3 𝐶𝑂𝐶𝐻2 𝐼 (𝑎𝑞) colourless + 𝐻𝐼 (𝑎𝑞) colourless As you can see the reaction mixture will start off yellow/brown and gradually fade to colourless which means that we can follow the reaction by colorimetry. Colorimeters work by passing a beam of light of a particular colour through a sample and measuring either the proportion of the light that passes through it (transmittance) or the proportion that gets absorbed (absorbance); in this experiment we will use absorbance. A solution of a given concentration of iodine will always have the same absorbance/transmittance (provided it is in the same container) so this gives us a way to monitor the concentration without having to measure it with fiddly titrations. When conducting experiments to determine the rate equation we need to find a way to measure the ‘initial rate’ of the reaction - i.e. the rate of the reaction at the very beginning - when we can be certain of the exact concentration of each of the reactants, before they have had time to change. To do this we need to produce a graph showing the first 120 seconds or so of the reaction so that we can draw a line of best fit. If we draw a tangent to our line of best fit at time 0, the gradient of this line will give us the initial rate of the reaction. In order to know the concentration of iodine that corresponds to a particular absorbance we first need to produce a calibration curve. We will measure the absorbance of iodine solutions of 10 different concentrations, graph it and draw a line of best fit. We can work backwards using the line of best fit to turn absorbance back into concentration. Task You will be given a spreadsheet called, ‘Iodination of Propanone Data’ and will have to analyse it fully in order to determine the rate equation. The task uses real world data, collected using the apparatus available in our lab, and so won’t produce the nice round, clear cut numbers you have seen in examples. All analytical approaches you use (and the experimental technique used) are things that you may be required to do for an Extended Essay, or in an Internal Assessment. Four experiments were completed, and only one run was completed for each one. The initial concentrations used were: Sulphuric acid (aq): 1.00 mol dm-3 Propanone (aq): 1.00 mol dm-3 Iodine (aq): 0.0200 mol dm-3 The experiments contained the following proportions of each solution: Volume (cm3) Experiment Sulphuric Propanone Iodine Acid 1 0.75 1.50 0.75 2 0.75 0.75 0.75 3 0.75 0.75 1.50 4 1.50 0.75 0.75 Distilled Water 0.00 0.75 0.00 0.00 You will be supplied with the data collected to produce the calibration curve, and the data collected by the datalogger during the four experiments Constructing the Calibration Curve The calibration curve was produced by filling cuvettes with 0.0200 mol dm-3 aqueous iodine solution and distilled water in the proportions shown below, and recording the absorbance in a colorimeter using light with a wavelength of 430 nm (purple). You will need to complete this section on the ‘CalibrationCurve’ page of the spreadsheet. Solution Number 1 2 3 4 5 6 7 8 9 10 Volume of 0.0200 M iodine solution (cm3) 5.00 4.50 4.00 3.50 3.00 2.50 2.00 1.50 1.00 0.50 Volume of distilled water (cm3) 5.00 5.50 6.00 6.50 7.00 7.50 8.00 8.50 9.00 9.50 1. Using the initial concentration of iodine, and the proportions given above, determine the concentration of each iodine solution. 2. Construct an appropriate graph with absorbance on the x-axis and concentration of iodine on the y-axis Note: Normally the independent variable (i.e. concentration) should be on the x-axis, but we want to be able to produce a line of best fit with an equation in terms of x, such that we calculate a concentration from a given absorbance. 3. Add a line of best-fit to your graph, choosing whichever you think is best, and include the formula and R2 value for the line. Calculating the Initial Rates of Reaction On the ‘Data’ page you will see four empty columns labelled ‘Iodine Concentration’, you will need to use your calibration curve to calculate the iodine concentration from each point. Once this has been done, we will need to graph concentration vs time, and use the line produced to determine the rate. 4. Calculate the concentration of iodine for Experiment 1 at t = 0.0 by writing a formula with the same structure as the equation of your calibration curve, using absorbance as your ‘x’ value. 5. Highlight all the cells in the concentration column (except the header), and press ‘Ctrl+D’ to copy the formula into all these cells. 6. Highlight all the cells in the concentration column for Experiment 1, Press ‘Ctrl+C’ to copy, then highlight the first concentration cell in Experiment 2, and press ‘Ctrl+V’ to copy the formulas into these cells. Repeat this for Experiments 3 and 4. 7. Do the following for each experiment separately: a. Produce an appropriate graph with time on the x-axis and concentration on the y-axis. b. Add the most suitable line of best fit, including equation and R2 value. c. Determine the initial rate and record it in the relevant column of the green table on the ‘Analysis’ page: i. If your line of best fit is a straight line, this is simply the negative of the gradient ii. If your graph is curved, you will need to differentiate the equation for the line and solve for x = 0. Determining the Rate Equation Now you have all you need to determine the rate equation. This should all be done on the ‘Analysis’ page. 8. Use the volumes of each solution and their initial concentrations to determine the concentration of each reactant at the beginning of each reaction. 9. Using the reasoning you have seen in lessons, deduce the order of the reaction with respect to each reactant. Note: the numbers involved do not work perfectly, as is the nature of real-life data, so you will have to use your judgement in reaching answers. 10. Using your answers to question 9, determine the overall rate equation for the reaction. 11. Using your answer to question 10, calculate the rate constant for each run of the experiment. Analysis and Evaluation 1. How do the values of the rate constant compare to each other? Are they close enough that you can reasonably call them constants? 2. Are the shapes of your concentration time graphs consistent with the stated order of the reaction? 3. What improvements do you think could be made to the experiment to improve the overall accuracy and reliability? 4. Why do you think the experiment uses purple light rather than red light in the colorimeter?
