AP Statistics Hypothesis Testing for Proportions Got milk? In
advertisement

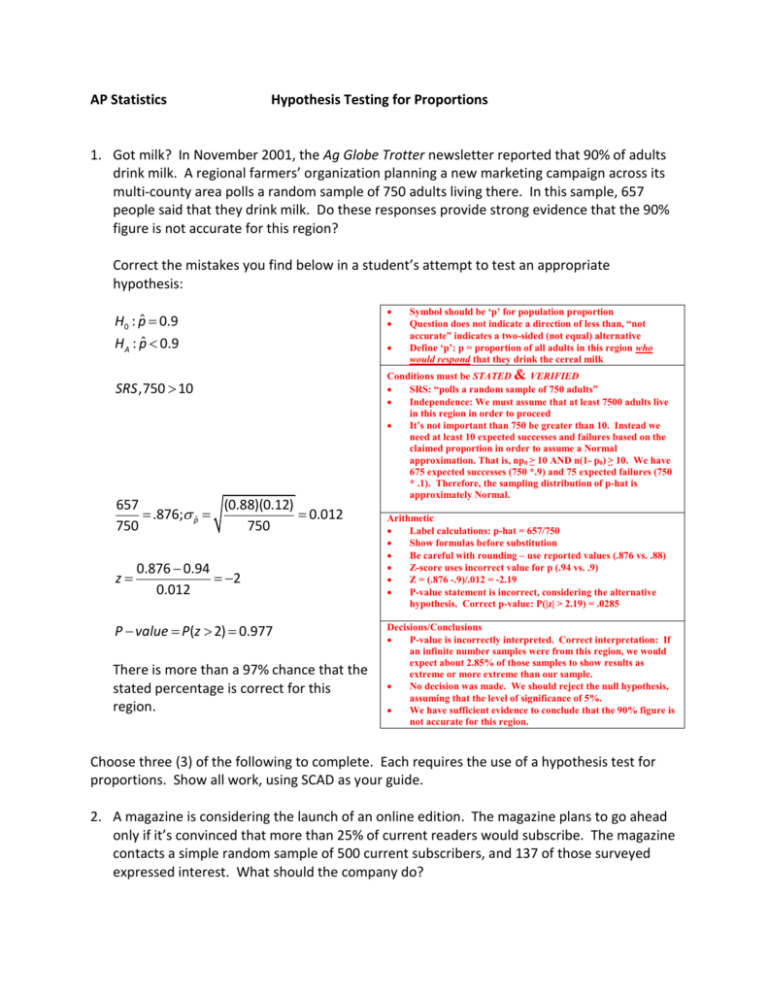
AP Statistics Hypothesis Testing for Proportions 1. Got milk? In November 2001, the Ag Globe Trotter newsletter reported that 90% of adults drink milk. A regional farmers’ organization planning a new marketing campaign across its multi-county area polls a random sample of 750 adults living there. In this sample, 657 people said that they drink milk. Do these responses provide strong evidence that the 90% figure is not accurate for this region? Correct the mistakes you find below in a student’s attempt to test an appropriate hypothesis: H0 : pˆ 0.9 HA : pˆ 0.9 SRS ,750 10 657 (0.88)(0.12) .876; pˆ 0.012 750 750 z 0.876 0.94 2 0.012 P value P(z 2) 0.977 There is more than a 97% chance that the stated percentage is correct for this region. Symbol should be ‘p’ for population proportion Question does not indicate a direction of less than, “not accurate” indicates a two-sided (not equal) alternative Define ‘p’: p = proportion of all adults in this region who would respond that they drink the cereal milk Conditions must be STATED & VERIFIED SRS: “polls a random sample of 750 adults” Independence: We must assume that at least 7500 adults live in this region in order to proceed It’s not important than 750 be greater than 10. Instead we need at least 10 expected successes and failures based on the claimed proportion in order to assume a Normal approximation. That is, np0 > 10 AND n(1- p0) > 10. We have 675 expected successes (750 *.9) and 75 expected failures (750 * .1). Therefore, the sampling distribution of p-hat is approximately Normal. Arithmetic Label calculations: p-hat = 657/750 Show formulas before substitution Be careful with rounding – use reported values (.876 vs. .88) Z-score uses incorrect value for p (.94 vs. .9) Z = (.876 -.9)/.012 = -2.19 P-value statement is incorrect, considering the alternative hypothesis. Correct p-value: P(|z| > 2.19) = .0285 Decisions/Conclusions P-value is incorrectly interpreted. Correct interpretation: If an infinite number samples were from this region, we would expect about 2.85% of those samples to show results as extreme or more extreme than our sample. No decision was made. We should reject the null hypothesis, assuming that the level of significance of 5%. We have sufficient evidence to conclude that the 90% figure is not accurate for this region. Choose three (3) of the following to complete. Each requires the use of a hypothesis test for proportions. Show all work, using SCAD as your guide. 2. A magazine is considering the launch of an online edition. The magazine plans to go ahead only if it’s convinced that more than 25% of current readers would subscribe. The magazine contacts a simple random sample of 500 current subscribers, and 137 of those surveyed expressed interest. What should the company do? Nearly 100% of all samples will show that more than 25% of current readers would subscribe. The company should launch an online edition. 3. Census data for a certain county shows that 19% of the adult residents are Hispanic. Suppose 72 people are called for jury duty, and only 9 of them are Hispanic. Does this apparent underrepresentation of Hispanics call into question the fairness of the jury selection system? Because p-value > alpha, we would fail to reject the null hypothesis. This is not a significant underrepresentation. This sample falls within the “usual” range of samples. 4. A start-up company is about to market a new computer printer. It decides to gamble by running commercials during the Super Bowl. The company hopes that name recognition will be worth the high cost of the ads. The goal of the company is that over 40% of the public recognize its brand name and associate it with computer equipment. The day after the game, a pollster contacts 420 randomly chosen adults, and finds that 181 of them know that this company manufacturers printers. Would you recommend that the company continue to advertise during Super Bowls? I would recommend that the company continue to advertise during Super Bowls. Because p-value > alpha, we would fail to reject the null hypothesis. We have sufficient evidence to suggest that more than 40% of the public would recognize its brand name and associate it with its computer equipment. 5. Some people are concerned that new tougher standards and high-stakes tests adopted in many states may drive up the high school dropout rate. The National Center for Education Statistics reported that the high school dropout rate for the year 2 000 was 10.9%. One school district, whose dropout rate has always been very close to the national average, reports that 210 of their 1782 students dropped out last year. Is their experience evidence that the dropout rate may be increasing? Their experience does not provide sufficient evidence that the dropout rate may be increasing. The p-value is greater than alpha. We would fail to reject the null hypothesis. 6. The National Center for Education Statistics monitors many aspects of elementary and secondary education nationwide. Their 1996 numbers are often used as a baseline to assess changes. In 1996, 34% of students had not been absent from school even once during the previous month. In the 2000 survey, responses from 8302 students showed that this figure had slipped to 33%. Officials would, of course, be concerned if student attendance were declining. Do these figures give evidence of a change in student attendance? These figures do not give evidence of a chance in student attendance. The p-value is greater than alpha. We would fail to reject the null hypothesis.


