How do you know how developed a country is
advertisement
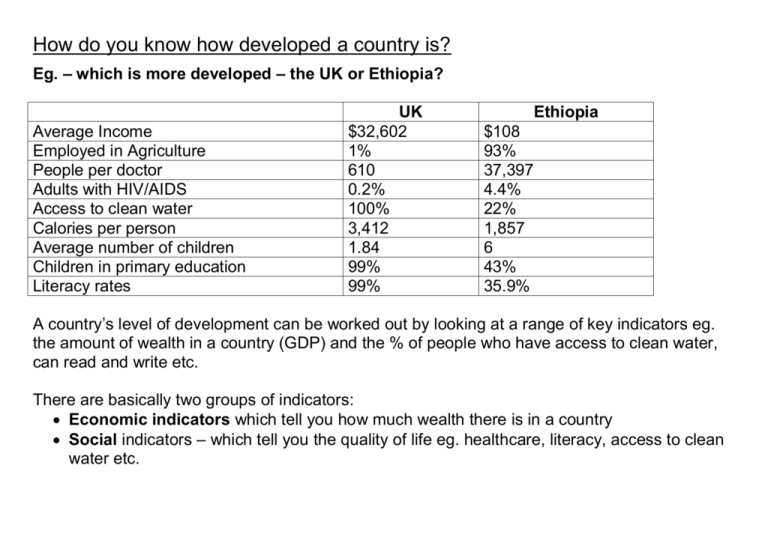
How do you know how developed a country is? Eg. – which is more developed – the UK or Ethiopia? Average Income Employed in Agriculture People per doctor Adults with HIV/AIDS Access to clean water Calories per person Average number of children Children in primary education Literacy rates UK $32,602 1% 610 0.2% 100% 3,412 1.84 99% 99% Ethiopia $108 93% 37,397 4.4% 22% 1,857 6 43% 35.9% A country’s level of development can be worked out by looking at a range of key indicators eg. the amount of wealth in a country (GDP) and the % of people who have access to clean water, can read and write etc. There are basically two groups of indicators: Economic indicators which tell you how much wealth there is in a country Social indicators – which tell you the quality of life eg. healthcare, literacy, access to clean water etc. The next two table are some of the indicators: Economic Indicators GDP or GNP: Gross Domestic /National Product: The total wealth of a country GDP or GNP per The total wealth of a country divided up per capita: person, usually measured in US dollars. LEDCs have low GNP/capita % of people on less - The % of people in a country who have to than 2 dollars a day try and survive on a very small amount of money See below for the table of Social Indicators Social Indicators Birth Rate: The number of births per 1000 people per year in a population. LEDCs have high birth rates Death rate: The number of deaths per 1000 people per year in a population. LEDCs have high death rates. Life Average age reached by people in a country, measured in Expectancy: years. In LEDCs, life expectancy is low. Infant Usually measured as the number of infants who die before Mortality: their fifth birthday, this is high in many LEDCs People per The total population of a country divided by the number of Doctor: doctors to go around. This indicates the general access to health care. LEDCs usually have high numbers of people per doctor. Adult Literacy: The % of people in a population who can read and write, this measures access to education. Low in LEDCs. Access to % of a population with safe drinking water, this is low in clean water: LEDCs Daily Calorie The average calorie intake by a population, this is low in Intake: LEDCs. % of This reflects how industrialised a country is. In LEDCs population many people are still employed in agriculture. (High). employed in Agriculture: Human Development Index: Each of these indicators provide insight to a countries development, however, they do not give an overall picture of a countries development. The UN created the Human Development Index to compensate for this. The HDI combines the following development indicators: · Life expectancy: As a population indicator for the country. · Literacy rate: As an education indictor for the country. · Standard of Living: Worked out using the country’s GDP and Purchasing Power (PPP) HDI then creates a ranking of the different countries around the world. Causes of global inequality These can be broken down into into 4 groups. D E B T Debt burden Many MEDC countries had spare money during the 1970’s and 1980’s. They loaned this money to LEDCs but charged them interest. This has meant LEDC countries have paid back the original loans but are still paying back the interest. They therefore have no spare money to develop their own countries. Environmental Environmental crises may occur in any country. Some are man made, e.g. deforestation and desertification whilst others are down to the natural environment. For example earthquakes in Japan, Floods in Bangladesh. Because of Colonialism This is a historical cause. It is due to MEDCs exploiting former colonies for their natural resources. Many LEDCs were invaded by rich countries. Terms of Trade Many LEDC countries rely on primary products e.g. coffee or copper. Countries trade with each other but conditions of trade can be very unfair on LEDCs. Tariffs, quotas and subsidies are the main issues.
