Satellite Interpretation for Weather Analysis
advertisement
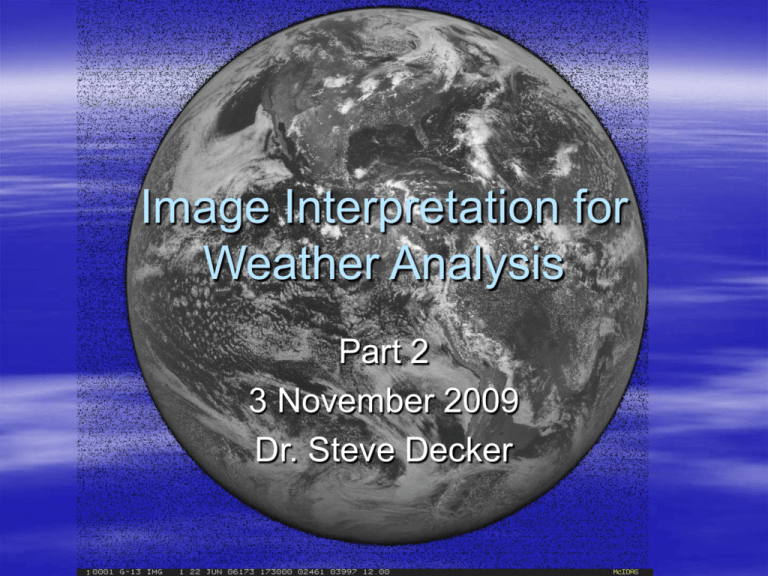
Image Interpretation for Weather Analysis Part 2 3 November 2009 Dr. Steve Decker Improvement Example Registration GOES-12 vs. GOES-13 Battery power Severe Thunderstorm Detection Severe thunderstorms often have notable overshooting tops Vis: Shadow effects IR: “Enhanced-V” signature Example: Vis IR Boundary Detection Boundary: Subtle separation between two air masses Region of enhanced lifting – Clouds – Thunderstorms Best seen in Vis Lake Breeze example Blowing Snow Can produce whiteout conditions, even with no precipitation Vis example Common Channels Visible – 0.65 μm (red) Infrared (IR) – 10.7 μm Water Vapor – 6.7 μm Shortwave IR – 3.9 μm Atmospheric Absorptivity Shortwave IR An infrared window channel – Just like “longwave” IR Also sees solar radiation (blackbody curve overlap) Works best for warmer temps – > -30°C – Cold clouds (e.g., cirrus) look mottled – Good for fire detection Fog detection Supercooled vs. ice clouds Snow vs. cloud Fire Detection with Shortwave IR Fires show up as “hot spots” SoCal fire example Fog Detection Emissivity of liquid water cloud at 3.9 μm is less than at longer wavelengths. – Fog shows up as lower temperatures – Appears brighter Opposite true for ice crystals (cirrus) Fog Detection Emissivity of liquid water cloud at 3.9 μm is less than at longer wavelengths. – Fog shows up at lower temperatures – Appears brighter Differences can be maximized by taking the difference between the longwave and shortwave IR images Supercooled Cloud Detection Supercooled cloud droplets frequently occur for -20°C < T < 0°C Detection method – Identify cloud-top temperatures conducive for supercooled droplets using longwave IR – Just like fog/stratus droplets, supercooled droplets emit less radiation in shortwave IR Supercooled Example http://weather.msfc.nasa.gov/sport/goes_imager/goes_imager.html Snow vs. Cloud During the day, low clouds will reflect more solar radiation than snow at 3.9 μm, so low clouds appear darker (more signal) than snow. Urban Heat Islands Shortwave IR is more sensitive to emissions from warmer temperatures – Urban heat islands show up better Water Vapor Channel Not an IR window – Does not see the ground (Exception) Absorbed/emitted by water vapor Colder temperatures imply: – More moisture in the mid and upper troposphere – Possible regions of ascent Temperature differences important; not their magnitudes Example Identifying Jet Streams Jet Streams – Ribbons of quickly moving air near the tropopause – Separate air masses – Support active weather Vis: Band of cirrus clouds on equatorward side Vapor: Strong moisture gradient – Dry air poleward – Moist air equatorward Locating Ridges and Troughs Upper tropospheric flow often contains a ridge/trough pattern Clouds often occur downstream of troughs, but upstream of ridges If ridge has small amplitude, clouds may “spill over” ridge Cloud band ahead of trough often indicates “warm conveyor belt” immediately ahead of a surface cold front – Southern extent of solid band marks trough axis Water Vapor Examples Eddies Cyclone development – Occlusion stage 1 2 Mountain waves – Java example Current weather Many More Examples CIMSS Satellite Blog

