ECE 283 Digital Communication
advertisement
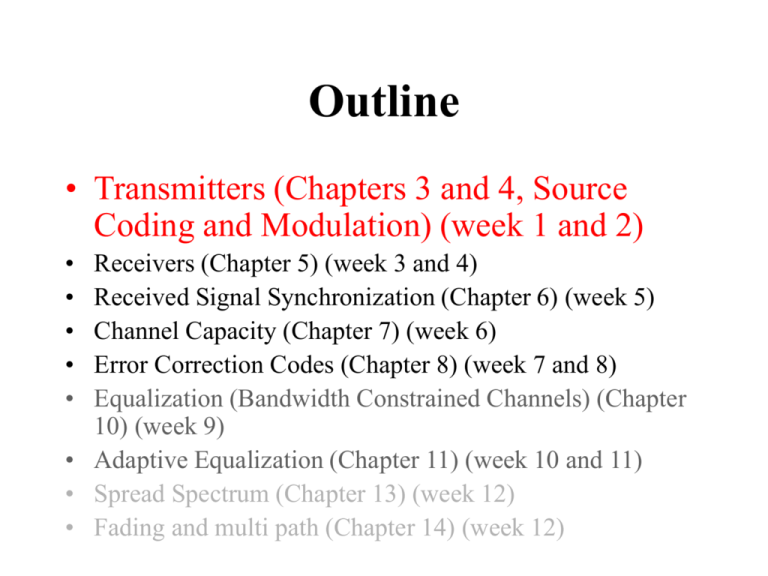
Outline
• Transmitters (Chapters 3 and 4, Source
Coding and Modulation) (week 1 and 2)
•
•
•
•
•
Receivers (Chapter 5) (week 3 and 4)
Received Signal Synchronization (Chapter 6) (week 5)
Channel Capacity (Chapter 7) (week 6)
Error Correction Codes (Chapter 8) (week 7 and 8)
Equalization (Bandwidth Constrained Channels) (Chapter
10) (week 9)
• Adaptive Equalization (Chapter 11) (week 10 and 11)
• Spread Spectrum (Chapter 13) (week 12)
• Fading and multi path (Chapter 14) (week 12)
Transmitters (week 1 and 2)
•
•
•
•
Information Measures
Vector Quantization
Delta Modulation
QAM
Digital Communication System:
Information per bit increases
Bandwidth efficiency increases
noise immunity increases
Transmitter
Receiver
Transmitter Topics
• Increasing information per bit
• Increasing noise immunity
• Increasing bandwidth efficiency
Increasing Noise Immunity
• Coding (Chapter
8, weeks 7 and 8)
Increasing bandwidth Efficiency
• Modulation of
digital data into
analog waveforms
– Impact of
Modulation on
Bandwidth
efficiency
QAM modulation
• Quadrature Amplitude Modulation
– Really Quadrature Phase Amplitude
modulation
sm (t ) Re ( Amc jAms ) g (t )e
j 2f c t
Amc g (t ) cos 2f c t Ams g (t ) sin 2f c t
Vm g (t ) cos( 2f c t m )
Amplitude and Phase modulation
m 1,2, , M
0t T
g(t) is a pulse waveform to
control the spectrum,
e.g., raised cosine
QAM waveforms
• To construct the wave forms we need to
know fc, g(t), Amc, and Ams
• However, we can write sm(t) as an linear
combination of orthonormal waveforms:
sm (t ) sm1 f1 (t ) sm 2 f 2 (t )
QAM waveforms
• QAM orthonormal waveforms:
sm (t ) sm1 f1 (t ) sm 2 f 2 (t )
f1 (t )
f 2 (t )
2
g
2
s m sm1
g (t ) cos 2f ct
Amc
g (t ) sin 2f ct
g
g
g 2 (t )dt
sm 2
g
2
Ams
2
g
QAM signal space
sm2
• QAM wave form can
be represented by just
the vector sm
– (still need fc, g(t), and
g to make actual
waveforms)
• Signal space
Constellation
determines all of the
code vectors
sm1
Euclidean distance between codes
(e)
d mn
sm sn
( sm1 sn1 ) ( sm 2 sn 2 )
2
2
sm2 1 2 sm1sn1 sn21 sm2 2 2 sm 2 sn 2 sn22
m
s m s n 2s m s n
2
m
sm
Re( mn )
2
n
2
m
n
Re( mn )
2
Is the Energy of the signal
sm sn
m
Is the cross correlation of the signals
n
Euclidean distance between codes
• Signals of similar energy and highly cross
correlated have a small Euclidean
separation
• Euclidean separation of adjacent signal
vectors is thus a good measure of the ability
of one signal to be mistaken for the other
and cause error
• Choose constellations with max space
between vectors for min error probability
Rectangular QAM signal space
• Minimum Euclidean
distance between
the M codes is?
sm2
sm1
Rectangular QAM signal space
• Euclidean distance between the M codes is:
Amc dim , Ams djm , im 1,2, M , jm 1,2, M
Anc din , Ans djn , in 1,2, M , jn 1,2, M
(e)
d mn
sm sn
d
g
2
(( Amc Anc ) ( Ams Ans ) )
2
((im in ) ( jm jn ) )
2
g
2
2
Rectangular QAM signal space
• Minimum euclidean
distance between
the M codes is: d 2
sm2
g
d
(e)
min
min d
(e)
mn
d 2 g
sm1
Channel Modeling
• Noise
– Additive
– White
– Gaussian
Contaminated baseband signal
Baseband Demodulation
• Correlative receiver
• Matched filter receiver
64-QAM Demodulated Data
Bandwidth required of QAM
• If k bits of information is encoded in the
amplitude and phase combinations then the
data rate:
R k /T
Where 1/T = Symbol Rate = R/k
Bandwidth required of QAM
• Can show that bandwidth W needed is
approximately 1/T for Optimal Receiver
1 R
R
W
T k log 2 M
Where M = number of symbols
(k = number of bits per symbol)
Bandwidth required of QAM
• Bandwidth efficiency of QAM is thus:
M
R
log 2 M
W
R/W
64
32
16
8
4
2
6
5
4
3
2
1
Bandwidth required of QAM
M
R/W
64
32
16
8
4
2
6
5
4
3
2
1
Actual QAM bandwidth
• Consider Power Spectra of QAM
Band-pass signals can be expressed
s (t ) Re v(t )e j 2f ct
Autocorrelation function is
ss ( ) Re vv ( )e
j 2f c
Fourier Transform yields Power spectrum in
Terms of the low pass signal v(t) Power spectrum
1
ss ( f ) vv ( f f c ) vv (( f f c ))
2
Actual QAM bandwidth
• Power Spectra of QAM
For linear digital mod signals
v(t )
n
I
n
Sequence of symbols is
For QAM
n
g (t nT )
{I n }
I n Anc jAns
Actual QAM bandwidth
1
*
*
vv ( ) E[ I n I m ]g (t nT ) g (t mT )
2 n m
m
ii
Assume stationary symbols
(m) g (t nT ) g (t nT mT )
*
m
Time averaging this:
_
Where ii (m)
1
vv ( ) ii (m) gg ( mT )
T m
Fourier Transform:
1
2
vv ( f ) G ( f ) ii ( f )
T
1
E[ I n* I n m ]
2
Actual QAM bandwidth
1
2
vv ( f ) G ( f ) ii ( f )
T
G(f) is Fourier transform of g(t)
ii ( f ) is power spectrum of symbols
Actual QAM bandwidth
G(f) is Fourier transform of g(t)
Actual QAM bandwidth
G(f) is Fourier transform of g(t)
Actual QAM bandwidth
ii ( f ) power spectrum of symbols
•Determined by what data you send
•Very random data gives broad spectrum
Actual QAM bandwidth
1
ss ( f ) vv ( f f c ) vv (( f f c ))
2
1
2
vv ( f ) G ( f ) ii ( f )
T
White noise for random
Symbol stream and QAM?
Channel Bandwidth
• 3-dB bandwidth
• Or your definition and
justification
• g(t) =
Modulated 64-QAM spectrum
