Loanable Funds Market: Macroeconomics Presentation
advertisement
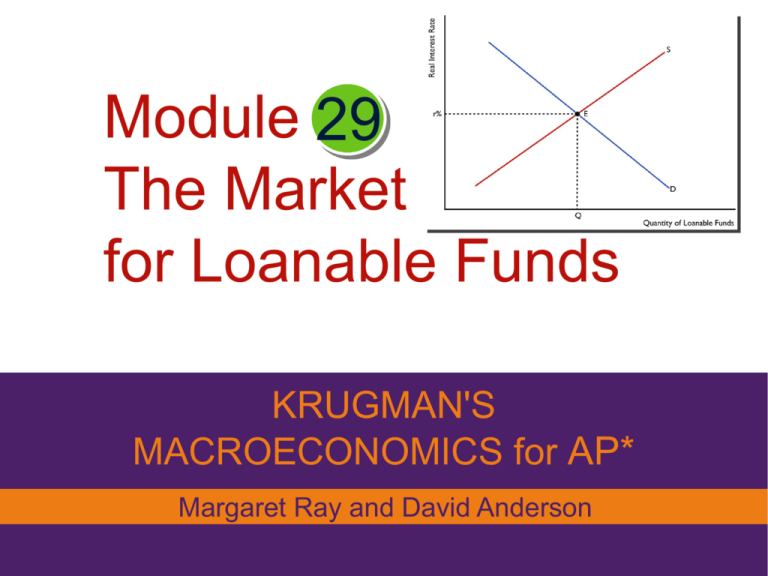
Module 29 The Market for Loanable Funds KRUGMAN'S MACROECONOMICS for AP* Margaret Ray and David Anderson What you will learn in this Module: • How the loanable funds market matches savers and investors • The determinants of supply and demand in the loanable funds market • How the two models of interest rates can be reconciled The Market for Loanable Funds •The Equilibrium Interest Rate •Loanable Funds Market •Nominal v. Real Interest Rate •Rate of Return •The laws of supply and demand explain the behavior of savers and borrowers The Market for Loanable Funds •Remember – I = Private Savings + Public Savings + Capital Inflow •Savers supply the S (lenders) •Investors demand the D (borrowers) •Loanable Fund Model used to determine the Equilibrium Real Interest Rate •The laws of supply and demand explain the behavior of savers and borrowers •Real Interest Rate (r) = nominal interest rate – expected inflation Equilibrium in the Loanable Funds Market Real Interest Rate (r) = nominal interest rate – expected inflation Funded projects Lend offers NOT accepted Unfunded projects Lend offers accepted Shifts of the Demand for Loanable Funds • ∆ Perceived Business Opportunities • Growing economy = right shift • Recession = left shift Shifts of the Demand for Loanable Funds • ∆ Government Borrowing • Budget deficit = more borrowing = right shift • Budget surplus = less debt so less borrowing = left shift Shifts of the Demand for Loanable Funds • Crowding Out Higher Interest rates will cause some investment to be ‘crowded out’ by the government’s demand for loadable funds. Shifts of the Supply of Loanable Funds • ∆ Private Savings Behavior • Consume more = save less = left shift Shifts of the Supply of Loanable Funds • ∆ Capital Inflows • A nation is perceived to have a stable government, strong economy, a good place to save money. • Foreign $$$ will flow into nation’s financial market, increasing the S of loadable funds. Inflation and Interest Rates •Anything that shifts either the S or D for loanable funds changes the interest rate. •Borrowers – true cost of borrowing is the real interest rate •Lenders – true payoff of lending is the real interest rate Inflation and Interest Rates •The Fisher Effect • As long as the Level of Inflation is Expected • NO affect on • Equilibrium Q of loanable funds • Expected real interest rate • Yes affect on nominal interest rate This Inflation and Interest Rates This graph shows that the only thing rising is the Nominal Interest Rate. Equilibrium Q Is the same. D and S for Loanable funds Will be at Equilibrium At the higher Nominal interest rate. Reconciling the Two Interest Rate Models: The Interest Rate in the Short Run Reconciling the Two Interest Rate Models: The Interest Rate in the Long Run Graph Practice Use a correctly labeled graph to show how the market for loanable funds is affected. Show in your graph the impact on the equilibrium interest rate and Q of loanable funds. 1. The chair of the Federal Reserve testifies before Congress that he/she expects the health of the economy to significantly improve in the coming months. 2. Households fear an imminent recession and begin to cut bank on discretionary purchases. 3. The Federal government announces another annual budget surplus. 4. The flow of foreign financial capital into American financial markets begins to decrease.
