Advisor Name
Firm
Address
City, St Zip
(555) 333-8888
Company website
Financial Market Update
—February 28, 2015
The summary below is provided for educational purposes only. If you have any thoughts or would like to
talk about any other matters, please feel free to contact me.
Fundamentals Reassert, Yellen on Rates, and Gasoline Prices Drive off Lows
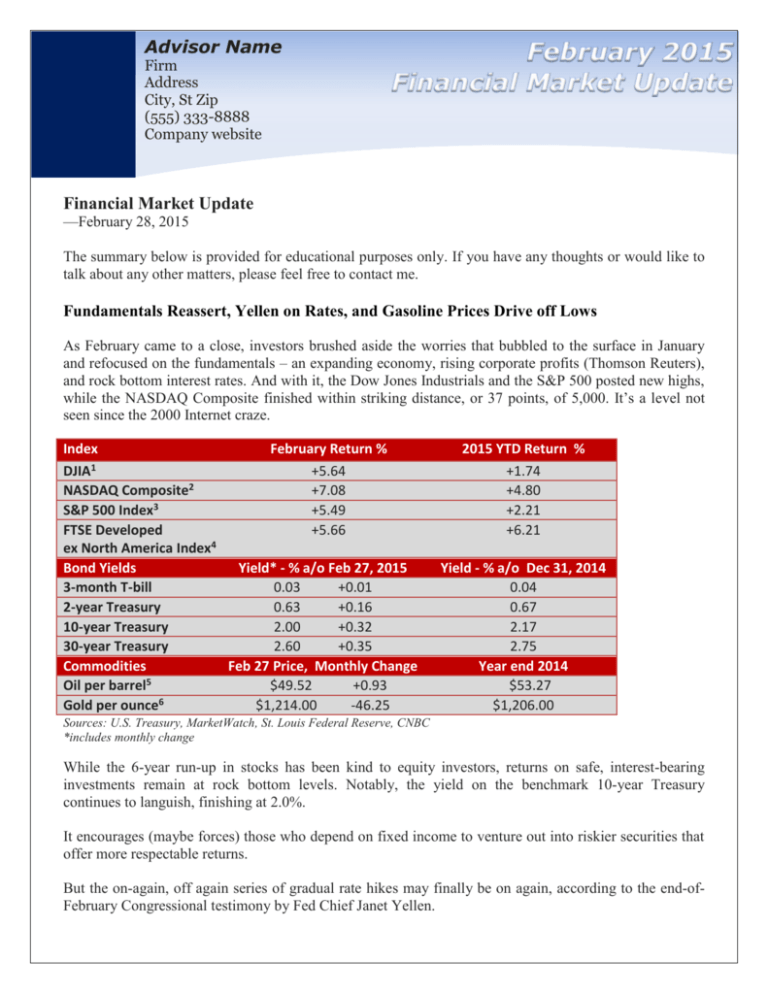
As February came to a close, investors brushed aside the worries that bubbled to the surface in January
and refocused on the fundamentals – an expanding economy, rising corporate profits (Thomson Reuters),
and rock bottom interest rates. And with it, the Dow Jones Industrials and the S&P 500 posted new highs,
while the NASDAQ Composite finished within striking distance, or 37 points, of 5,000. It’s a level not
seen since the 2000 Internet craze.
Index
February Return %
1
DJIA
+5.64
2
NASDAQ Composite
+7.08
3
S&P 500 Index
+5.49
FTSE Developed
+5.66
4
ex North America Index
Bond Yields
Yield* - % a/o Feb 27, 2015
3-month T-bill
0.03
+0.01
2-year Treasury
0.63
+0.16
10-year Treasury
2.00
+0.32
30-year Treasury
2.60
+0.35
Commodities
Feb 27 Price, Monthly Change
5
Oil per barrel
$49.52
+0.93
6
Gold per ounce
$1,214.00
-46.25
2015 YTD Return %
+1.74
+4.80
+2.21
+6.21
Yield - % a/o Dec 31, 2014
0.04
0.67
2.17
2.75
Year end 2014
$53.27
$1,206.00
Sources: U.S. Treasury, MarketWatch, St. Louis Federal Reserve, CNBC
*includes monthly change
While the 6-year run-up in stocks has been kind to equity investors, returns on safe, interest-bearing
investments remain at rock bottom levels. Notably, the yield on the benchmark 10-year Treasury
continues to languish, finishing at 2.0%.
It encourages (maybe forces) those who depend on fixed income to venture out into riskier securities that
offer more respectable returns.
But the on-again, off again series of gradual rate hikes may finally be on again, according to the end-ofFebruary Congressional testimony by Fed Chief Janet Yellen.
In her semi-annual Monetary Policy Report to Congress, Yellen conceded that more needs to be done on
the job front, but she acknowledged there has been “important progress” toward one of the Federal
Reserve’s key objectives – full employment.
“As long as employment keeps growing, Yellen said, the Fed “anticipates that it will be appropriate to
raise the fed funds rate when, on the basis of incoming data, the committee (that determines the fed funds
rate) is reasonably confident that inflation will move back over the medium term toward our 2%
objective.”
Bureau of Labor Statistics data reveal the steep decline in oil prices is largely responsible for the
downturn in overall inflation. In January, the broad-based PCE Price Index fell 0.5% from the prior month
and is up a scant 0.2% from the prior year (Bureau of Economic Analysis).
But if you look at what economists call core inflation, which removes food and energy, price increases
have been fairly stable and benign – less the 2% annually for almost three years (Figure 1). For the Fed,
that is too benign, as it remains below its annual goal of 2%.
PCE Price Index and Core PCE Price Index
Fig. 1
Percent
3.0
2.5
Fed 2% inflation target
2.0
1.5
1.0
0.5
PCE Price Index
Core PCE Price Index
0.0
Jan-10
Jan-11
Jan-12
Jan-13
Data Source: St. Louis Federal Reserve, Bureau of Economic Analysis
Jan-14
Jan-15
Last Date: Jan 2015; Note: Like the Consumer Price Index, the PCE Price Index is a broad-based measure of prices
What’s noteworthy is that we haven’t seen the drop in oil prices bleed through to the broader price level.
That’s not too surprising since an expanding economy doesn’t incent businesses to cut prices. Think of
the airlines, which have barely reduced airfares per BLS pricing data. And oil prices won’t fall forever.
While Yellen didn’t get overly specific, much of her language was designed to lay the groundwork for a
rate hike later in the year.
Her goal: telegraph to investors that the Fed wants the flexibility to act when it believes the data warrants
a rate hike. But as the Fed prepares for a likely liftoff in rates, Yellen is quite cognizant of the scars left by
the Great Recession.
“We will want to feel confident that the recovery will continue and that inflation is moving up over time.
There are also, of course, risks of waiting too long to remove accommodation,” she noted in the Q&A
session with Congressional committee members (Bloomberg).
Those risks include economic distortions caused by low interest rates and the potential for whipping up
unwanted inflation. It’s a delicate balancing act.
Seasonal ritual – gasoline prices rebound
If you’ve filled up your tank lately, you’re not alone if you’ve noticed an uptick in gasoline prices. Our
friends in California have been hammered, with an average price of $3.31 per gallon for regular gasoline
as of February 28.
This compares with Nevada at $2.73, which is the next highest (excluding Hawaii, GasBuddy.com). The
average price across the U.S. is $2.40. But that’s still below the average of a year ago of $3.45. If you’re
keeping score, Utah is the cheapest at $2.02.
Data published weekly by the Energy Information Administration (EIA) reveals that regular gasoline
prices peaked last year on April 28 at $3.71 and plummeted to $2.04 by January 26, 2015. By February
23, the price had rebounded to $2.33, but it’s still $1.11 per gallon below the average U.S. price from a
year ago.
While I’m mindful that sharp cutbacks in capital spending among the oil companies and oil-service
providers is creating pain in the energy patch, longer-term the savings is set to support economic activity.
In her Congressional testimony last month, Yellen acknowledged the negative impact on energy
producers, but noted, “It (falling gasoline prices) will likely be a significant overall plus, on net, for our
economy.”
Where prices might be headed in the short term? If seasonality continues to play a role, higher is the short
answer – see Figure 2.
Weekly Average Price Regular Gasoline: 2000-2014
25.0%
Fig. 2
Memorial Day
weekend
20.0%
15.0%
Labor Day
10.0%
5.0%
Average Price 2000-2014
0.0%
-5.0%
Price change 2015
-10.0%
1
5
9
13
17
Data Source: Energy Information Administartion
Last 2015 date: Feb. 23, 2015
21
25
Week#
29
33
37
41
45
49
Over the last 15 years, prices have risen by an average of 20% between January 1 and Memorial Day
weekend.
While gasoline continued to slide through much of January, seasonality has reasserted itself and we’re
back on track.
Factors that have played a role include an uptick in oil prices, but other variables are in play.
Scheduled maintenance to prepare for the transition from winter blends to the more expensive summer
blends of gasoline is impacting some parts of the country. And there is also the general expectation of the
upcoming summer driving season.
Then there are factors that are specific to the current situation.
Data from the EIA suggest that gasoline usage is up as lower prices encourage increased driving. The
largest refinery strike in 35 years is occurring at plants that account for 20% of U.S. gasoline production
(LA Times), and its coming at a time of very cold weather in the Northeast, which increases demand for
heating oil at the expense of gasoline production.
A recent explosion and fire at an Exxon refinery in California (Reuters) is creating havoc in the Golden
State. Finally, prices may have just overshot to the downside.
It’s important from an economic standpoint because we’re experiencing sharp cutbacks in capital
spending among oil producers. Yet, various surveys of consumer spending, including MasterCard (Wall
Street Journal) and retail sales data (U.S. Commerce Department) suggest that consumers have been slow
to recycle their gas savings into new spending.
Warmest Regards,
Advisors Name/Signature
Share!
It’s OK with us if you would like to share the Market Update with your friends,
family and neighbors. We love meeting new folks!
It is important that you do not use this e-mail to request or authorize the purchase or sale of any security or commodity, or
to request any other transactions. Any such request, orders or instructions will not be accepted and will not be processed.
All items discussed in this report are for informational purposes only, are not advice of any kind, and are not intended as a
solicitation to buy, hold, or sell any securities. Nothing contained herein constitutes tax, legal, insurance, or investment
advice.
Stocks and bonds and commodities are not FDIC insured and can fall in value, and any investment information, securities
and commodities mentioned in this report may not be suitable for everyone.
U.S. Treasury bonds and Treasury bills are guaranteed by the U.S. government and, if held to maturity, offer a fixed rate of
return and guaranteed principal value. U.S. government bonds are issued and guaranteed as to the timely payment of
principal and interest by the federal government. Treasury bills are certificates reflecting short-term (less than one year)
obligations of the U.S. government.
Past performance is not a guarantee of future performance. Different investments involve different degrees of risk, and
there can be no assurance that the future performance of any investment, security, commodity or investment strategy that is
referenced will be profitable or be suitable for your portfolio.
The information has been obtained from sources considered to be reliable, but we do not guarantee that the foregoing
material is accurate or complete. The information contained in this report does not purport to be a complete description of
the securities, markets, or developments referred to in this material. Any information is not a complete summary or
statement of all available data necessary for making an investment decision and does not constitute a recommendation.
Before making any investments or making any type of investment decision, please consult with your financial advisor and
determine how a security may fit into your investment portfolio, how a decision may affect your financial position and how
it may impact your financial goals.
All opinions are subject to change without notice in response to changing market and/or economic conditions.
1
The Dow Jones Industrials Average is an unmanaged index of 30 major companies which cannot be invested into directly. Past
performance does not guarantee future results.
2 The NASDAQ Composite is an unmanaged index of companies which cannot be invested into directly. Past performance does not
guarantee future results.
3 The S&P 500 Index is an unmanaged index of 500 larger companies which cannot be invested into directly. Past performance does not
guarantee future results.
4 The FTSE Developed ex North America Index is an unmanaged index of large and mid-cap stocks providing coverage of developed markets,
excluding the US and Canada. It cannot be invested into directly. Past performance does not guarantee future results.
5 New York Mercantile Exchange front-month contract; Prices can and do vary; past performance does not guarantee future results.
6 London Bullion Market Association; gold fixing pricing at 3 p.m. London time; Prices can and do vary; past performance does not
guarantee future results.
Copyright © 2015 Financial Jumble, LLC All rights reserved.


