File - Cynthia Wheatley
advertisement

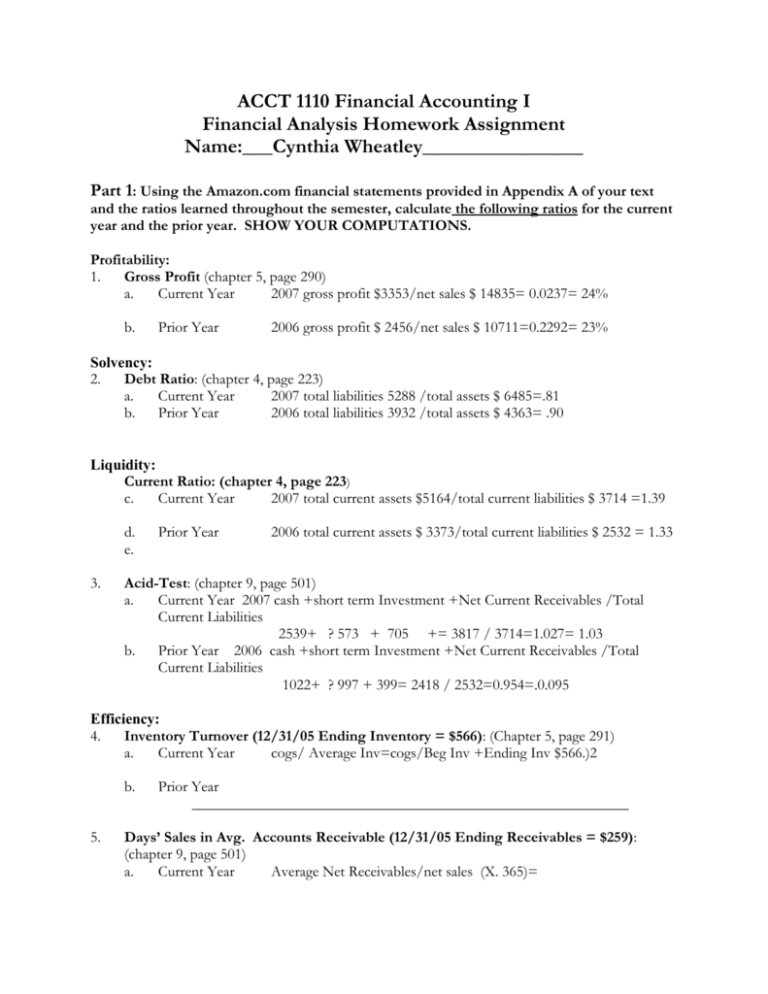
ACCT 1110 Financial Accounting I Financial Analysis Homework Assignment Name:___Cynthia Wheatley________________ Part 1: Using the Amazon.com financial statements provided in Appendix A of your text and the ratios learned throughout the semester, calculate the following ratios for the current year and the prior year. SHOW YOUR COMPUTATIONS. Profitability: 1. Gross Profit (chapter 5, page 290) a. Current Year 2007 gross profit $3353/net sales $ 14835= 0.0237= 24% b. Prior Year 2006 gross profit $ 2456/net sales $ 10711=0.2292= 23% Solvency: 2. Debt Ratio: (chapter 4, page 223) a. Current Year 2007 total liabilities 5288 /total assets $ 6485=.81 b. Prior Year 2006 total liabilities 3932 /total assets $ 4363= .90 Liquidity: Current Ratio: (chapter 4, page 223) c. Current Year 2007 total current assets $5164/total current liabilities $ 3714 =1.39 d. e. 3. Prior Year 2006 total current assets $ 3373/total current liabilities $ 2532 = 1.33 Acid-Test: (chapter 9, page 501) a. Current Year 2007 cash +short term Investment +Net Current Receivables /Total Current Liabilities 2539+ ? 573 + 705 += 3817 / 3714=1.027= 1.03 b. Prior Year 2006 cash +short term Investment +Net Current Receivables /Total Current Liabilities 1022+ ? 997 + 399= 2418 / 2532=0.954=.0.095 Efficiency: 4. Inventory Turnover (12/31/05 Ending Inventory = $566): (Chapter 5, page 291) a. Current Year cogs/ Average Inv=cogs/Beg Inv +Ending Inv $566.)2 b. 5. Prior Year __________________________________________________________ Days’ Sales in Avg. Accounts Receivable (12/31/05 Ending Receivables = $259): (chapter 9, page 501) a. Current Year Average Net Receivables/net sales (X. 365)= b. Prior Year __________________________________________________________ General questions: 6. What is the cost flow method used to value inventory? (read notes, Appendix A) A-9 It says Amazon.com uses the FIFO method, and is valued at the lower cost or the market value. This valuation requires them to make judgments, based on current information. 7. What indicates that the company complied with the Lower-of-Cost-or-Market Principle? (read notes, Appendix A) Based on this evaluation, they adjust the carrying amount of their inventories to lower of cost or market sale by using the FIFO cost flow method such as through sales to individual customers, returns of products, Vendors, or liquidations and expected recoverable values of each deposition category Financial Analysis Accounting 1110 Cynthia Wheatley Financial Analysis I have carefully analyzed the company Amazon.coms Financials for 2006 and 2007 and there are a few things I will be addressing matters such as their profitability, solvency, liquidity, as well as efficiency. The first topic I will go over is their Profitability using the gross profit percentage method. Inventory is the most important asset for a merchandiser. This method is important and is one of the most watched measures of profitability. In order to compute the gross profit percentage you must take the gross profit and divide it by the net sales revenue to get your percentage. Amazon.com percentages increased from 23% to 24% from 2006-2007. The second topic is solvency, solvency is found by measuring the debt ratio. The debt ratio is what indicates the proportion of a company’s assets that are financed in debt. You take the company’s total liabilities divided by their total assets and that’s how you get the company’s Debt Ratio. A debt ratio below 0.60 or 60% is considered safe for most businesses. A debt ratio above 0.80 or 80% is a high risk. Amazon.com had a high percentage rate of .90% in 2006 but lowered a little to .81 in 2007 so as you can see, Amazon.com borders at high risk in this current year. The third topic of importance that we are going to go over is Liquidity with using the current ratio measures. Currents ratio measures a company’s ability to pay for its current liabilities. The current ratio method is the company’s total current assets divided by the total current liabilities. Companies prefer to have high current ratios because it will mean the company has plenty of currents assets to pay its current liabilities. A strong current ratio is 1.50 and this tells us that the company has $1.50 in current assets for every $1.00 in current liabilities. When looking at Amazon.com’s financials, their current ratio was at 1.33 in 2006 and increased to 1.39 in 2007 so Amazon.com has a safe current ratio for their liquidity and the increase shows there wasn’t any deterioration and this is a good sign as well. Next we will introduce the fourth topic of efficiency. A more stringent way to measure the company’s ability to pay current liabilities is called the acid test ratio. The acid test can tell you whether or not the company’s entities can pay for all of its current liabilities is they were to become due. The way an acid test ratio works is the higher the ratio the better. The acid test ratio has some different variables for each different type of company though as well. A ratio of 1.07 is a strong store while other huge industries can run smoothly on a 0.20 because they have little receivables. I did a acid test with Amazon.com from their financials by adding cash + short term investments+ net current receivable and then dividing the total of those to the total current liabilities. I came up with 0.095 and increased to 1.03 in 2007 which tells me the company is doing great in their efficiency department. In closing I have concluded that I couldn’t find any huge red flags as a whole that might signal financial trouble for Amazon.com. Amazon.com seems to have a good movement of sales, Inventory and receivables every year their percentages have raised never decreasing with the exception of their debt ratio. There wasn’t any decrease in cash flow from operations. My biggest and only concern would be too much debt based on the debt ratio percentage being so high and increasing 9% in one year when compared to other competitors and would Amazon.com be able to pay off its debts.


