US Freight Railroad Economics
advertisement
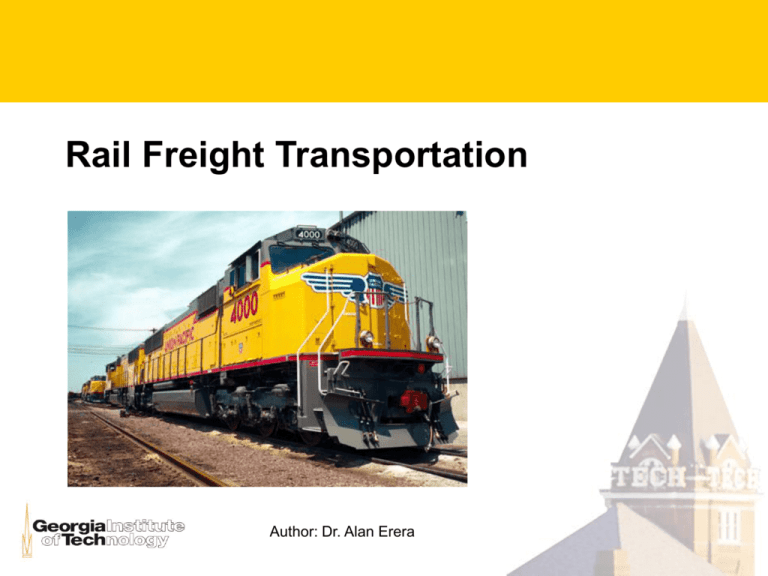
Rail Freight Transportation Author: Dr. Alan Erera North American Mode Share, 1996 % of total ton-miles air water rail truck U.S. Freight Movements, 1996 (Millions of metric tons) 1990 1995 1996 Total Air Water transport Coastal shipping Great Lakes Inland waterwaysa 6,079.30 7.7 1,014.00 270.9 99.9 643.2 7,062.00 8.5 985.4 241.9 105.3 638.1 7,320.70 9.8 991.9 242.6 104.2 645.1 Pipeline Crude oil and petroleum products Natural gas 1,416.20 958.9 457.3 1,551.60 1,017.00 534.6 1,611.80 1,067.80 544 Railroad Truck 1,292.60 2,348.70 1,405.80 3,110.70 1,461.40 3,245.90 Railroad Freight Flows U.S. Freight Railroad Economics In 1998 ... • Market share: 40% of intercity tons • Large share markets: – 70% of finished automobiles – 64% of coal (generating 36% of electricity) – 40% of grain (domestic and export) U.S. Railroad Economics II • Movement statistics – Freight volume: 1.38 trillion ton-miles – Carload volume: 26 million carloads • 8.8 million intermodal trailers and containers • Fleet statistics – 1.3 million railcars – 127 million ton capacity • Costs 26% less (57% IA) than 1981 Railroads are capital-intensive Primary Commodities • Rail Only – – – – – Coal Farm Products Non-metallic minerals Petroleum Chemicals 572 MM tons 158 131 123 118 • Intermodal – Transportation equipment 6.9 MM tons – Chemicals, food, lumber, pulp & paper Georgia Rail Freight Growth in Intermodal Growth in Intermodal • 17% of revenues – second only to coal: 23% • COFC 62%, TOFC 38% • Why? – Labor efficiency – Fuel efficiency (50% savings over truck) – Door-to-door service • Downsides – speed, reliability Container land bridge Long Beach Elizabeth • Asia - Europe market • Double-stack N.A. network • Why? – Hub-and-spoke efficiencies – Panama canal costs, queuing delays NAFTA freight flows for UP Freight Railroad Classification • Class One – Operating revenue > $250 MM (1991$) – 91% of total revenue, 71% of track – CSX, NS, UP, BNSF, Kansas City Southern • Regionals – Revenue $40-250 MM, more than 350 miles – Wisconsin Central, Bangor & Aroostook, Alaska • Local/Short Lines CSX • • • • • Miles: 23,000 Carloads: 5.1 MM Locos: 4,000 Railcars: 100,000 Revenues: $5.6 B – coal: $1.6 B – chem: $0.91 B – auto: $0.76 B Norfolk Southern • • • • • Miles: 21,800 Carloads: 5.1 MM Locos: 3,500 Railcars: 117,000 Revenues: $5.2 B – – – – coal: $1.3 B intermodal: $0.83 B auto: $0.73 B chem: $0.73 B Union Pacific • • • • • Miles: 38,600 Carloads: 8.5 MM Locos: 6,847 Railcars: 157,000 Revenues: $10.2 B – – – – coal: $2.2 B intermodal: $1.7 B chem: $1.6 B auto: $1.0 B BNSF • • • • Miles: 33,500 Locos: 5,000 Railcars: 90,000 Revenues: $9.1 B – – – – carload: $2.6 B intermodal: $2.5 B coal: $2.2 B agri: $1.3 B Kansas City Southern • Miles: 6,400 • NAFTA railroad – – – – – Gateway Western KCS TexMex TFM Panama Canal RR Canadian National • • • • • Miles: 16,000 Carloads: 3.5 MM Locos: 5,000 Railcars: 90,000 Revenues: $5.1 B – – – – grain: $1.0 B forest: $0.97 B chem: $0.84 B intermodal: $0.80 B Locomotive Equipment • They are mobile power plants – Diesel generators – DC and AC traction motors • Road vs. switching • Multiple units – consist – DPUs and helpers for heavy trains, grades Pre-diesel UP locomotives UP Road Locomotive • AC traction (6000 HP) CSX Roads in Two-engine consist Yard switcher • Often “retired” road locomotives • Low HP (1500) Boxcars • Weather-protection • Insulation, refrigeration, cushioning • Auto parts, building materials, food products, bagged products Automobile Racks (autoracks) • Bi-level or tri-level • Damage/vandalism protection • Finished autos, trucks, vans, minivans Load/unload operations: autoracks • a type of “roll-on, roll-off” system Open hoppers • Hopper openings or rotary couplers • Coal, coke, stone, sand, ores, gravel Load operations: coal • conveyors Unload operations: coal Covered hoppers • load: round or trough hatch • unload: hoppers (gravity, airslide) • grains, corn, soybeans, flour, salt, sugar, clay, phosphates, cement, fertilizers, plastics Tank cars • Private (non-railroad) fleets • Chemicals, molasses, water, diesel fuel Gondolas • Open or covered • Scrap metal, aggregates, woodchips, logs, poles, steel beams, steel coils Load/unload: Lumber on flatcars TOFC • Trailer-on-flatcar • Highway trailers – LTL trucking growth in intermodal TOFC train COFC • Container-on-flatcar • ocean shipping containers, trucking containers Double-stack COFC (1979) • Articulated cars • Clearances – bridge/tunnel investments Load/unload: Double-stack COFC Intermodal flatcar types • Two-hitch flatcar – two trailers, each up to 40 ft length • Articulated well flatcar – containers sit low for double-stacking – articulation: no conflict with rail wheels (trucks) – 3 to 5 permanently joined units • Roadrailer – truck trailers mounted on railroad wheel assemblies EOT Device • End-of-train device • Caboose replacement – warns following trains • Crew size reduction – brakemen, fireman gone – 2-4 person crews – labor cost reduction Rail shipping • Shipment types – Unit train (bulk commodities) – Carload (FCL) – Less-than-carload (LCL) • Train types – – – – Unit train (through service) Hot shot (intermodal; expedited service) Bulk train (single bulk commodity) Manifest (mixed freight) Unit train routing • Direct, through trains – From shipper to consignee • Coal train example – Powder River Basin, WY to Dallas area power plant • Petrochemical example – Elizabeth, NJ refinery to Houston processing plant – Interline Intermodal train routing • Expedited service – But, set-outs or pick-ups at consolidation points • Load/unload intermodal yards – Portside (e.g. Long Beach) – Port adjacent (e.g. Oakland) – Inland • Enroute yards – “hubs” – cross-towns (rubber tire transfers) Manifest (mixed freight) train routing • Load/unload facilities – Shipper sidings, public facilities (e.g. grain elevators) – Switching service to terminal railyard • Hump yards – Classification • sorting by destination – Receiving, bowl, departing – Hub-and-spoke concept North Platte Hump Yard (UP) US Deregulation: Staggers (1980) • Market-driven pricing – only for route/services with competition • Confidential service agreements, rates • Abandonment and sale streamlined • Impact – – – – Costs down: 57% from 1981 to 1998 Return on net investment: from 2 to 7% Consolidation Regionals and shortlines: 50,000 miles Post-deregulation performance Railroad misconceptions • Not technologically advanced … – $247 billion investment since 1980 – Advanced signaling, communication, control • Rolling stock outdated … – 7,500 new locomotives since 1990 (37.5%) – Freight cars lighter, stronger, more reliable BN Operating center Freight railroads: no subsidies! • Track privately-owned and operated – construction and maintenance • Amtrak – pays “usage fees” to freight railroads • Trucking uses public infrastructure – C&M funding via $0.55/gallon fuel tax but … – Estimate: covers only 2/3 of costs
