Amazon Statments Analysis Edited
advertisement
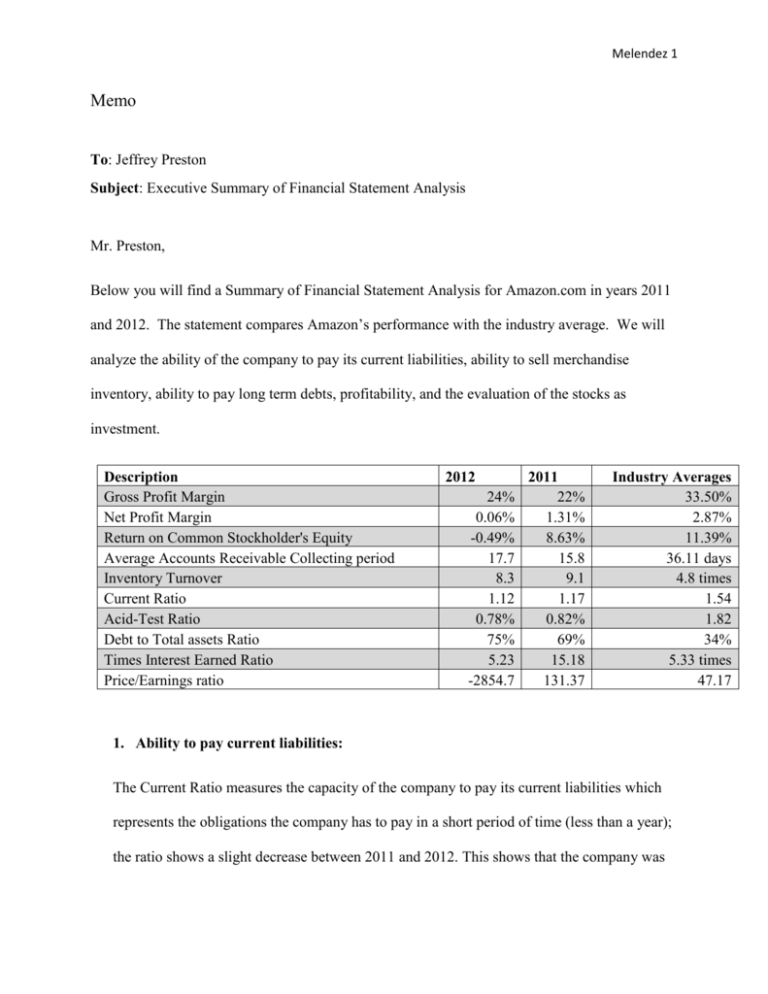
Melendez 1 Memo To: Jeffrey Preston Subject: Executive Summary of Financial Statement Analysis Mr. Preston, Below you will find a Summary of Financial Statement Analysis for Amazon.com in years 2011 and 2012. The statement compares Amazon’s performance with the industry average. We will analyze the ability of the company to pay its current liabilities, ability to sell merchandise inventory, ability to pay long term debts, profitability, and the evaluation of the stocks as investment. Description Gross Profit Margin Net Profit Margin Return on Common Stockholder's Equity Average Accounts Receivable Collecting period Inventory Turnover Current Ratio Acid-Test Ratio Debt to Total assets Ratio Times Interest Earned Ratio Price/Earnings ratio 2012 24% 0.06% -0.49% 17.7 8.3 1.12 0.78% 75% 5.23 -2854.7 2011 22% 1.31% 8.63% 15.8 9.1 1.17 0.82% 69% 15.18 131.37 Industry Averages 33.50% 2.87% 11.39% 36.11 days 4.8 times 1.54 1.82 34% 5.33 times 47.17 1. Ability to pay current liabilities: The Current Ratio measures the capacity of the company to pay its current liabilities which represents the obligations the company has to pay in a short period of time (less than a year); the ratio shows a slight decrease between 2011 and 2012. This shows that the company was Melendez 2 in better condition in 2011 to pay their current liabilities. Amazon was below the industry average for both years. 2. Ability to sell merchandise inventory The ability to sell inventory is calculated through inventory turnover that measures the number of times the company sells its average level of merchandise during a year. Amazon turned over its inventory twice as fast as the industry average in 2011 and 2012. Amazon had a collecting period of 15.8 days in 2011 and 17.70 in 2012 while the industry average was 36.11 3. Ability to pay long term debts The ability to pay the long term debts are measured by Debt to total asset ratio. The ratio is expressed by dividing the total liabilities or obligations by the total assets. “A ratio of 1 shows that all assets are financed with debt”. Amazon reported 69% in 2011 and 75% in 2012 while industry average was 34%. Amazon had a 6% increase in assets that were financed between 2011 and 2012. Their ratio is almost double compared to the market industry. Which means that 75% of their assets are financed. 4. Profitability Profitability is measured using the profit Margin ratio which shows how much net income is earned on every dollar of net sales. The formula is “Net income divided by net sales” which means that more sales dollars are converted into profit. The average profit margin in the industry is 2.8% and Amazon posted 1.31% in 2011 and decreased in 2012 to 0.06%. The company was profitable but with a lower margin. Melendez 3 5. Evaluating stocks as investments The stocks evaluations are a measure of price earnings ratio which is expressed by dividing the market price per share of common stock by earnings per share. It can also be evaluated by looking at the rate of return on common stockholder’s equity. It shows the relationship between net income available to common stock holders and their average common equity invested in the company. The formula is net income- preferred dividend/ average common stockholders’equity. The industry average was 11.9% and Amazon had 8.63 % in 2011 and negative 0.49% in 2012. The investors had a slight loss of 0.49% in 2012 and made 8.63 for each dollar invested in 2011. In conclusion the company did well overall experiencing a small decline in 2012. Amazon continued to be profitable with a low margin. Compared to the industry average they excelled in recovering their receivables and moving their inventory, an average of 72% of their assets are financed. Their profitability from 2011 was under the average but was not bad, however 2012 had a dramatic drop and the stocks had 8.63% and 2012 dropped to -0.06 which is not attractive to investors.
