Galley of Graphs
advertisement
MATHS METHODS 1/2
TOPIC 3: GALLERY OF GRAPHS
ABSOLUTE VALUE GRAPHS
Definition: The absolute value of 𝑥, denoted |𝑥| or 𝑎𝑏𝑠(𝑥), represents the magnitude of x regardless of its sign.
Therefore:
𝑥 𝑖𝑓 𝑥 ≥ 0
|𝑥| = {
−𝑥 𝑖𝑓 𝑥 < 0
So for example |4| = 4, but |−4| = 4. The result of taking the absolute value of a number or expression is never
negative.
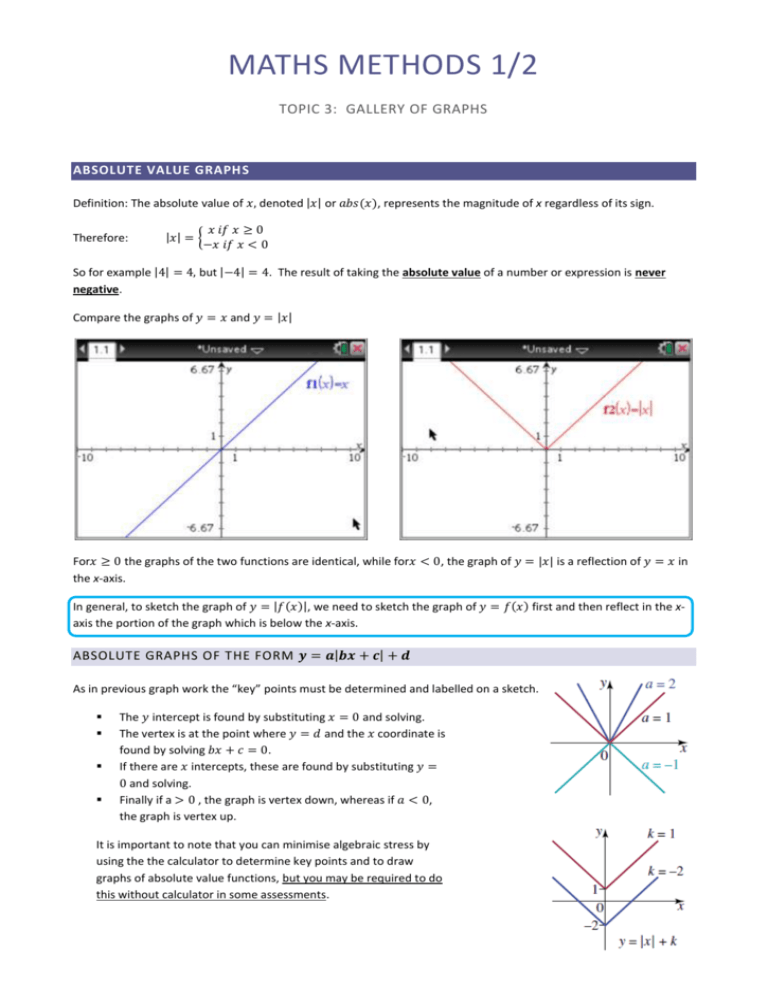
Compare the graphs of 𝑦 = 𝑥 and 𝑦 = |𝑥|
For𝑥 ≥ 0 the graphs of the two functions are identical, while for𝑥 < 0, the graph of 𝑦 = |𝑥| is a reflection of 𝑦 = 𝑥 in
the x-axis.
In general, to sketch the graph of 𝑦 = |𝑓(𝑥)|, we need to sketch the graph of 𝑦 = 𝑓(𝑥) first and then reflect in the xaxis the portion of the graph which is below the x-axis.
ABSOLUTE GRAPHS OF THE FORM 𝒚 = 𝒂|𝒃𝒙 + 𝒄| + 𝒅
As in previous graph work the “key” points must be determined and labelled on a sketch.
The 𝑦 intercept is found by substituting 𝑥 = 0 and solving.
The vertex is at the point where 𝑦 = 𝑑 and the 𝑥 coordinate is
found by solving 𝑏𝑥 + 𝑐 = 0.
If there are 𝑥 intercepts, these are found by substituting 𝑦 =
0 and solving.
Finally if a > 0 , the graph is vertex down, whereas if 𝑎 < 0,
the graph is vertex up.
It is important to note that you can minimise algebraic stress by
using the the calculator to determine key points and to draw
graphs of absolute value functions, but you may be required to do
this without calculator in some assessments.
It is recommended that you follow the following routine when using your calculator.
(a) From “Actions” menu use “define” to enter the rule of the function in the “calculator” section.
So 𝑦 = −2|3𝑥 − 6| + 4 would be entered as 𝑓(𝑥) = −2|3𝑥 − 6| + 4
(b) From the “Graph Screen” in the “Entry line”, enter 𝑓1 (𝑥) = 𝑓(𝑥)
(c) View the graph and, if necessary, adjust the window to be able to see vertex, 𝑦 intercept and any 𝑥
intercepts. This adjustment is completed using “Window/Zoom” from graph menu. Note that “Window
Settings” enables the student to be in control of the window location, whereas “Zoom Fit” is the calculator
attempt to fit the graph into the window automatically.
(d) Using the graph menu “Analyze Graph – Minimum(Maximum)” to find the approximate coordinates of the
vertex. Use “calculator” section menu “Algebra – Solve” to solve the equation 𝑓(𝑥) = 𝑑 to obtain the exact 𝑥
coordinate of the vertex, if necessary.
(e) Using the graph menu “Analyze Graph – Zero” to find the approximate coordinates of any 𝑥 intercepts.Use
“calculator” section menu “Algebra – Solve” to solve the equation 𝑓(𝑥) = 0 to obtain the exact 𝑥 intercepts,
if necessary.
(f) Use the “calculator” section menu with 𝑓(0) to obtain the exact 𝑦 intercept, if necessary.
(g) Finally make a good size copy of graph, clearly labelling key points with both 𝑥 and 𝑦 coordinates and also
label axes.
SOLVINGABSOLUTE VALUE FUNCTIONS
|2𝑥 − 3| must never be less than zero, irrespective of the value of 𝑥.
This means that if for 𝑥 = −6, |2𝑥 − 3| = |−15| = 15.
If 𝑥 = 0, |2𝑥 − 3| = |−3| = 3.
It also means that the equation |2𝑥 − 3| = −1, for example, has no solution.
In our “TInspire” calculator |𝑥| is entered as either 𝑎𝑏𝑠(𝑥) from catalogue or as |𝑥| from the template list, where it is
the first entry on the second row.
For Example: Solve |2𝑥 − 3| = 5
By hand: given |2𝑥 − 3| = 5, we must find the solution for 2𝑥 − 3 = 5 and −(2𝑥 − 3) = 5
∴ 𝑥 = 4 or 𝑥 = −1
Calculator: From calculator, enter “Solve” from
“Algebra” menu as follows:
For Example: Sketch the graph of 𝑦 = |2𝑥 − 3|
By hand: sketch the graph of 𝑦 = 2𝑥 − 3, then
reflect in the x-axis the portion of the graph for
which 𝑦 < 0
Calculator: graph screen key the equation into
“Entry line”.
You will see a " 𝑣 𝑠ℎ𝑎𝑝𝑒 𝑔𝑟𝑎𝑝ℎ" with vertex at
3
( , 0) and a 𝑦 intercept at (0, 3). Of course the 𝑥
2
3
intercept is also at ( , 0).
2
RECTANGULAR HYPERBOLAS
1
Base graph of the form 𝑦 = for 𝑥 ≠ 0
Note the following properties:
- When 𝑥 = 0
the function is undefined
- As 𝑥 → ∞
𝑦 → 0+
This indicates a horizontal asymptote, with the equation 𝑦 = 0
−
- As 𝑥 → −∞
𝑦→0
𝑥
-
As 𝑥 → 0−
-
+
𝑦 → −∞
This indicates a vertical asymptote, with the equation 𝑥 = 0
As 𝑥 → 0
𝑦→∞
DILATION
3
1
𝑥
3𝑥
Consider the graphs of 𝑦 = and 𝑦 =
Both 𝑦 = and 𝑦 =
3
1
𝑥
3𝑥
1
have the same ‘shape’ and asymptotes as 𝑦 = , but have been pulled either closer to
𝑥
or further away from the origin
3
1
𝑥
𝑥
For 𝑦 = : the basic graph of 𝑦 = has been dilated by a factor of 3; the point with coordinates (1, 1) is
replaced with (1, 3)
For 𝑦 =
1
3𝑥
1
1
𝑥
3
: the basic graph of 𝑦 = has been dilated by a factor of ; the point with coordinates (1, 1) is
1
replaced with (1, )
3
TRANSLATION
Consider the graphs 𝑦 =
For 𝑦 =
1
𝑥−2
1
𝑥−2
1
and 𝑦 = + 1
𝑥
1
: the basic graph of 𝑦 = has been translated +2 units on the horizontal axis; the equation of the
𝑥
vertical asymptote is now 𝑥 = 2
1
1
𝑥
𝑥
For 𝑦 = + 1: the basic graph of 𝑦 = has been translated +1 units on the vertical axis; the equation of the
horizontal asymptote is now 𝑦 = 1
These properties still hold true even when dilation is applied
GENERAL FORM
𝑎
𝑦 = 𝑥−ℎ + 𝑘
Where 𝑎 = dilation
−ℎ = horizontal translation, and 𝑥 = −ℎ gives the vertical asymptote
𝑘 = vertical translation, and 𝑦 = 𝑘 gives the horizontal asymptote
𝑎
We can use the properties to sketch all rectangular hyperbolas of the form 𝑦 =
Note: asymptotes which do not occur at 𝑥 = 0 or 𝑦 = 0 should be shown on your sketch as a ‘dashed’ line
with the equation of the asymptote clearly labelled
Exercise 5A
𝑥−ℎ
+𝑘
TRUNCUS
1
Base graph of the form 𝑦 =
Note the following properties:
- When 𝑥 = 0
the function is undefined
- There are no values of x which will produce a negative value of y
- As 𝑥 → ∞
𝑦 → 0+
This indicates a horizontal asymptote, with the equation 𝑦 = 0
- As 𝑥 → −∞
𝑦 → 0+
𝑥2
-
As 𝑥 → 0−
𝑦→∞
-
As 𝑥 → 0+
𝑦→∞
This indicates a vertical asymptote, with the equation 𝑥 = 0
DILATION & TRANSLATION
3
Consider the graphs of 𝑦 =
For 𝑦 =
dilated by a factor of 3
The point with the coordinates (1, 1) is
replaced with (1, 3)
3
𝑥2
𝑥2
: the graph of 𝑦 =
and 𝑦 =
1
𝑥2
1
(𝑥−2)2
has been
+1
For 𝑦 =
1
(𝑥−2)2
+ 1: the graph of 𝑦 =
1
𝑥2
has
been translated +2 horizontally and +1
vertically
The graph has the asymptotes 𝑥 = 1 and 𝑦 =
2
GENERAL FORM
𝑎
𝑦 = (𝑥−ℎ)2 + 𝑘
Where 𝑎 = dilation
−ℎ = horizontal translation, and 𝑥 = −ℎ gives the vertical asymptote
𝑘 = vertical translation, and 𝑦 = 𝑘 gives the horizontal asymptote
All graphs of this form will have the same ‘truncus’ shape
Exercise 5B
𝒚 = √𝒙
1
Base graph of the form 𝑦 = √𝑥 (or 𝑦 = 𝑥 2 )
Forms one half of the parabola 𝑥 = 𝑦 2
The function is defined for 𝑥 ≥ 0 and 𝑦 ≥ 0
The end point of the square root curve is at (0, 0)
DILATION & TRANSLATION
Consider the graphs of 𝑦 = 3√𝑥 − 1 and 𝑦 = −2√𝑥 − 1 + 4
For 𝑦 = 3√𝑥 − 1 : the graph of 𝑦 = √𝑥 has
been dilated by a factor of 3, and has been
translated horizontally by +1
The end point of the square root curve is at
(1, 0)
The point with the coordinates (4, 2) is
replaced with (4, 3√3)
For 𝑦 = −2√𝑥 − 1 + 4 : the graph of 𝑦 = √𝑥
has been dilated by a factor of 2 and reflected
in the x-axis
It has been translated horizontally by +1 and
vertically by +4
The end of the square root curve is at (1, 4)
The point with the coordinates (4, 2) is
replaced with (4, 4 − 2√3)
GENERAL FORM
𝑦 = 𝑎√𝑥 − ℎ + 𝑘
Where 𝑎 = dilation
−ℎ =horizontal translation
𝑘 =vertical translation
(−ℎ, 𝑘) = the end point of the square root curve
All graphs of this form will have the same ‘square root curve’ shape
Note that the end point of the square root curve is included and should be shown with a closed circle
Exercise 5C
CIRCLES
Circles can be graphed using an equation the form 𝑥 2 + 𝑦 2 = 𝑟 2 , where r = radius of the circle
The base graph for a circle is 𝑥 2 + 𝑦 2 = 1
Note the following properties:
- Origin (centre) of the circle is at (0, 0)
- Radius of the circle is 1
TRANSFORMATIONS
Given that r indicates the radius of the circle, it acts as the dilation
All translation occurs around the origin of the circle
Consider the graphs 𝑥 2 + 𝑦 2 = 4 and (𝑥 − 2)2 + (𝑦 + 1)2 = 1
For 𝑥 2 + 𝑦 2 = 4: the origin is at (0, 0)
The radius is given by 𝑟 2 = 4 ∴ 𝑟 = 2
For (𝑥 − 2)2 + (𝑦 + 1)2 = 1: the origin is at
(2, -1)
The radius is given by 𝑟 2 = 1 ∴ 𝑟 = 1
GENERAL FORM
(𝑥 − ℎ)2 + (𝑦 − 𝑘)2 = 𝑟 2
Where 𝑟 = radius
−ℎ =horizontal translation
𝑘 =vertical translation
(−ℎ, 𝑘) = the origin of the circle
FINDING Y-INTERCEPTS TO SKETCH
When finding the y-intercepts of the graphs of circle equations, we following the usual process but must
remember to account for both the positive and negative root
For example: find the y-intercepts of the following and provide a sketch of the graph
-
(𝑥 + 3)2 + (𝑦 − 1)2 = 16
We know the circle has origin point (-3, -1) and radius 4
To find the y-intercepts we let 𝑥 = 0
(0 + 3)2 + (𝑦 − 1)2 = 16
9 + (𝑦 − 1)2 = 16
(𝑦 − 1)2 = 7
𝑦 − 1 = ±√7
∴ 𝑦 = 1 ± √7
Label the origin and the y-axis intercepts
At times it is necessary to complete the square in order to find the y-intercepts
For example: find the y-intercepts of the following
𝑥 2 + 𝑦 2 + 4𝑥 − 6𝑦 − 12 = 0
- Complete the square:
(𝑥 2 + 4𝑥 + 4) − 4 + (𝑦 2 − 6𝑦 + 9) − 9 − 12 = 0
(𝑥 2 + 4𝑥 + 4) + (𝑦 2 − 6𝑦 + 9) = 25
(𝑥 + 2)2 + (𝑦 − 3)2 = 25
-
Let 𝑥 = 0 to find the intercepts
(0 + 2)2 + (𝑦 − 3)2 = 25
4 + (𝑦 − 3)2 = 25
(𝑦 − 3)2 = 21
𝑦 − 3 = ±√21
∴ 𝑦 = 3 ± √21
SEMICIRCLES
If we transpose the general equation of the circle to make y the subject, we can then consider the positive
and negative root as two separate equations
These form the two halves of the circle
CIRCLE GRAPHS ON YOUR CALCULATOR…!
To draw a circle on your calculator, from the graphs page
- press menu
- 3: Graph Entry/Edit
- 2: Equation
- 3: Circle
- 1: (𝑥 − ℎ)2 + (𝑦 − 𝑘)2 = 𝑟 2
**Note – you can enter the equation in either format, depending on what you are provided with
Exercise 5D
Chapter 5 Review
