practice solving with tables and graphs
advertisement
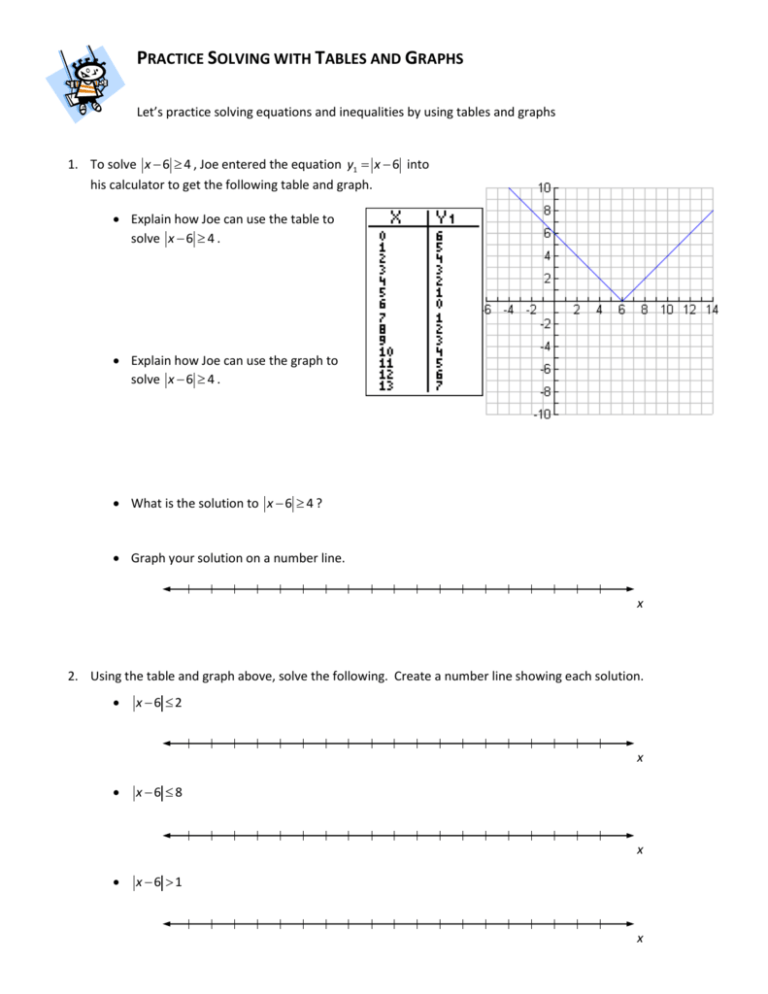
PRACTICE SOLVING WITH TABLES AND GRAPHS Let’s practice solving equations and inequalities by using tables and graphs 1. To solve x 6 4 , Joe entered the equation y1 x 6 into his calculator to get the following table and graph. Explain how Joe can use the table to solve x 6 4 . Explain how Joe can use the graph to solve x 6 4 . What is the solution to x 6 4 ? Graph your solution on a number line. x 2. Using the table and graph above, solve the following. Create a number line showing each solution. x 6 2 x x 6 8 x x 6 1 x 3. Create your own graph to help find solutions to the following. x 5 6 Solution: 6 x 5 Solution: x 5 3 Solution: 4. Create your own table to help find solutions to the following. x 80 40 Solution: 10 x 80 Solution: x 80 25 Solution: x 80 10 Solution: 5. Using your calculator’s table or graph, find solutions to the following. 3 k 7 21 Solution: 2 m 3 5 19 Solution: 4 p 6 5 19 Solution:

