19. In a particular market there are three commercial television
advertisement
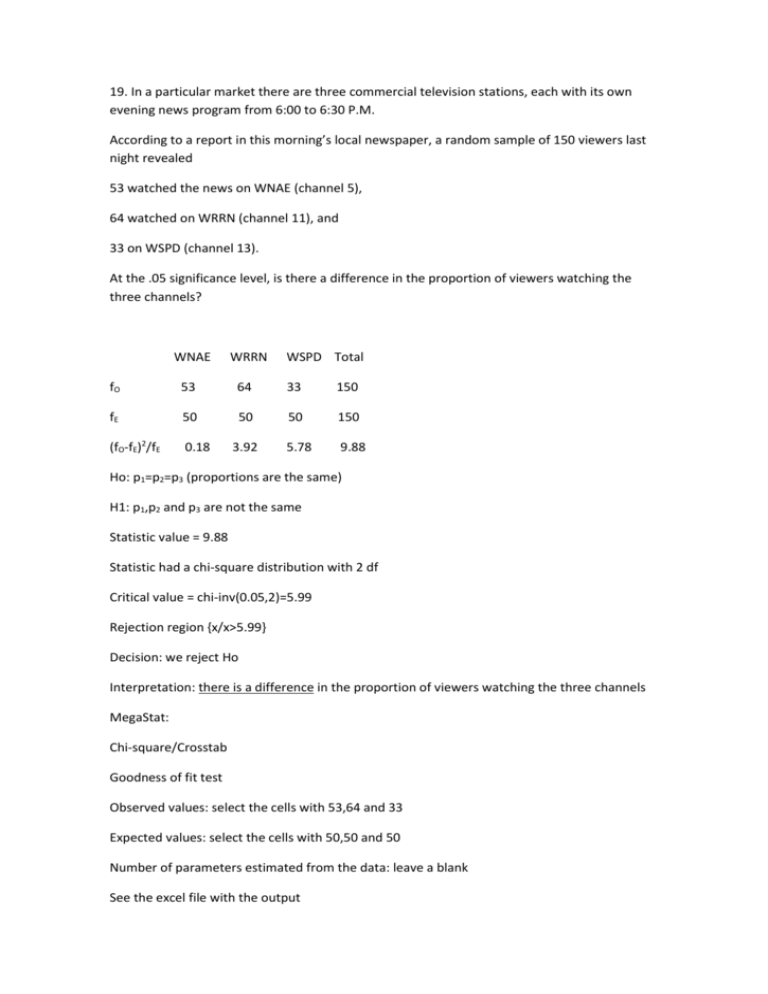
19. In a particular market there are three commercial television stations, each with its own
evening news program from 6:00 to 6:30 P.M.
According to a report in this morning’s local newspaper, a random sample of 150 viewers last
night revealed
53 watched the news on WNAE (channel 5),
64 watched on WRRN (channel 11), and
33 on WSPD (channel 13).
At the .05 significance level, is there a difference in the proportion of viewers watching the
three channels?
WNAE
WRRN
WSPD Total
fO
53
64
33
150
fE
50
50
50
150
(fO-fE)2/fE
0.18
3.92
5.78
9.88
Ho: p1=p2=p3 (proportions are the same)
H1: p1,p2 and p3 are not the same
Statistic value = 9.88
Statistic had a chi-square distribution with 2 df
Critical value = chi-inv(0.05,2)=5.99
Rejection region {x/x>5.99}
Decision: we reject Ho
Interpretation: there is a difference in the proportion of viewers watching the three channels
MegaStat:
Chi-square/Crosstab
Goodness of fit test
Observed values: select the cells with 53,64 and 33
Expected values: select the cells with 50,50 and 50
Number of parameters estimated from the data: leave a blank
See the excel file with the output
20. There are four entrances to the Government Center Building in downtown Philadelphia.
The building maintenance supervisor would like to know if the entrances are equally utilized.
To investigate, 400 people were observed entering the building. The number using each
entrance is reported below. At the .01 significance level, is there a difference in the use of the
four entrances?
Entrance Frequency (fO)
Main Street
140
Broad Street
120
Cherry Street
90
Walnut Street
50
Total
400
fE
100
100
100
100
400
(fO-fE)2/fE
16
4
1
25
46
Ho: u1=u2=u3 (there is no difference in the use between channels)
H1: u1,u2 and u3 are not the same
Statistic value = 46
Statistic had a chi-square distribution with 3 df
Critical value = chi-inv(0.01,3)=11.34
Rejection region {x/x>11.34}
Decision: we reject Ho
Interpretation: there is a difference in the use of the four entrances
MegaStat:
Chi-square/Crosstab
Goodness of fit test
Observed values: select the cells with 140,20,90 and 50
Expected values: select the cells with 100,100,100 and 100
Number of parameters estimated from the data: leave a blank
See the excel file with the output
