Marcellus Madness
advertisement
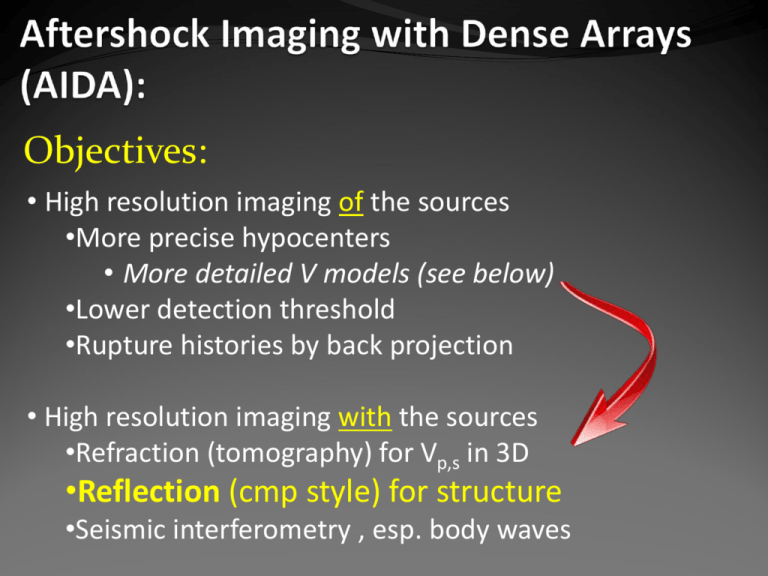
Objectives: • High resolution imaging of the sources •More precise hypocenters • More detailed V models (see below) •Lower detection threshold •Rupture histories by back projection • High resolution imaging with the sources •Refraction (tomography) for Vp,s in 3D •Reflection (cmp style) for structure •Seismic interferometry , esp. body waves What is “dense”? Typical aftershock deployment: a few tens of instruments at DX ~ kms to 10’s of kms AIDA: 100’s of instruments At Dx ~ 200 m ………………… . ………………… . ………………… . ………………… . ………………… . ………………… . ………………… . ………………… . ………………… . ………………… . ………………… …………………. . Aftershocks Mw 5.8 Non-AIDA Anti-alias: Dx < lmin/2 ~ 100m Z-component 3-component Non-AIDA •RT125 “Texan” • 4.5 Hz vertical geophone • 4.5 Hz 3C geophones (+ 3 Texans) • Fast deployment (~5 min) • Designed for controlled source (windowed recording) •Can record continuously ~10 days @ 100 sps • Uses standard D cell (2) Battery life ~ 3 days Procedures for changing battery while recording FlexArray Reftek Inc. Aftershock Hypocenters using AIDA Locations for >200 aftershocks from Aug 27-Sept 9, 2011 Strike ~26° Dip ~52° SE Data misfits < 40ms, ~200m in given velocity model Davenport, Hole et al Key Question: Reactivation or New Fault Aftershock zone geology: Aftershock Epicenters Piedmont Province crystalline thrust sheets August 23, 2011 (Modified from C. Bailey) Davenport, Hole et al Crustal Reflections from Earthquake Sources EQ Midpoints 6 km 0 5 10 sec Broadside arrivals From another EQ Dx = 200m P PxP S X PmP? Modeling reflections A2 A1 P direct A2 A1 P reflected S direct Model with horizontal Reflector at 6 km Reflection Geometry Virtual Well Surface Array meqk Aftershocks are in essence a Reverse VSP survey VSP CMP Imaging Schuster, 2009 Yu and Schuster, 2006 CRP Processing of rVSP Conventional CMP vs VSP-CRP: Reflection point is function of source AND reflector depths After Hardage, 2002 Reflection energy Trace mapped Multiple sources Single trace as Multiple recorders Binned and stacked recorded at surface to x, z Mineral VA in 3D rVSP + NMO (x,y,t) VA 1 eqk (single fold) Eqk Gather VA Earthquake Reflection Image: 3D Next CRP Stacking: Mapview: 3 Earthquakes Ideal Why not 5000 stations? True 3D/3C Example: Oyo GSR 1 month at 500 sps GPS onboard Cell QC, programmable > 4000 channels deployed in oil exploration What is practical with existing technology? Dx = 200m North Anna 100 ch 1000 ch 4000 ch 7.5 km Location Improvement: AIDA Maine (incl Weston Obs. Stations in blue and 10/23 epicenter as red icon) Quiros and Brown Cornell University 11/4/12 Wait, there’s more…. AIDA 3-C Fredericksburg North Ana Nuclear Plant Z-component 3-component 3 component EW Attenuation Measurements NS Z Surface Waves from Ambient Noise 4.5 Hz phones! Cross-Correlated with Station 5 Band Pass 0.01-1.6 Hz Offset Plot Velocity ~ 3500 ms-1 Processing: Band Pass-es 0.001-6 Hz. Station 5 is virtual souce. 5 days stacked. Virtual Surface Seismic Profile (seismic interferometry) Yu and Schuster, 2006 Source location is not needed! What about P, S from “Ambient Noise”? Virtual Shot Gather EQ distribution non-isotropic Virtual Source Cross-Correlation with Station 13 (7 days) Resembles EQ time-shifted to the surface Applications: Aftershocks 3D seismic structure Volcano seismicity 3D magmatic structure Induced microseismicity 3D P and S refraction&reflection Noisy environment? Detection threshold? Adv/Disadv vs borehole? 4D Needs for Crustal Imaging Large numbers (1000’s) Long lasting (months) Easily deployable Self locating 3C Sensors: 0.1-100hz ME Aftershock 10/27/12 Areal Array Dx ~ 5 km Quiros and Brown Cornell University 11/4/12 Dense Linear Array Dx = 200m Zoom Location Improvement AIDA Maine

