IT Value – Making “IT” Real
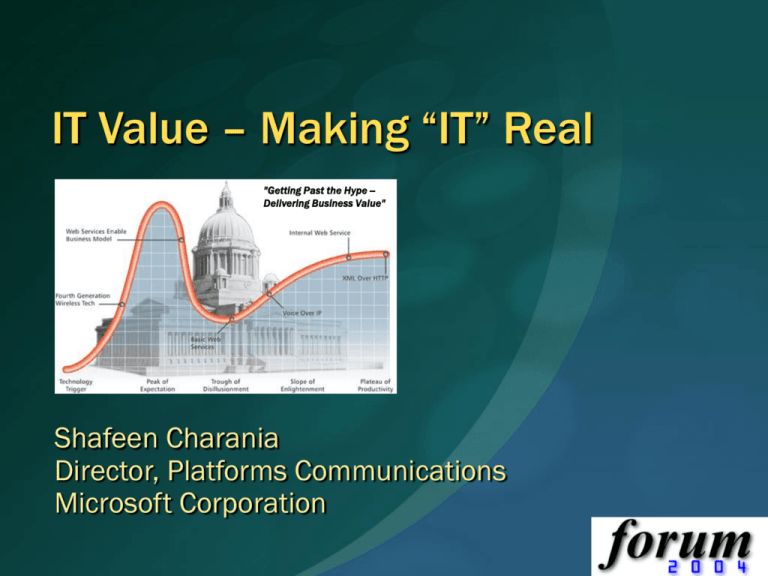
"Getting Past the Hype -Delivering Business Value"
Shafeen Charania
Director, Platforms Communications
Microsoft Corporation
The Value of IT?
© 2004 Microsoft Corporation. All rights reserved.
E-Government Hype Cycle Evolution
Source: Hype Cycle Shows E-Government Overcoming Disillusionment
3/17/04 - Gartner
© 2004 Microsoft Corporation. All rights reserved.
So – What Matters More???
IT…
…or the
Business???
Related question – what matters more –
the people? …or HR?
© 2004 Microsoft Corporation. All rights reserved.
Tracking the Impact of Information
Technology Investments
Impact Sought
Sample Value Measures
Revenue growth
BUSINESS UNIT FINANCIAL BV
Return on assets
Revenue per employee
Time to bring new product to mkt.
Sales from new products
Product or service quality
Time to implement a
new application
Cost to implement a
new application Information
BUSINESS UNIT OPERATIONAL
BV
BUSINESS UNIT
IT APPLICATIONS BV
Technology $
Infrastructure availability
Cost per transaction
Cost per workstation
Responsibilities
FIRM-WIDE
IT INFRASTRUCTURE BV
Information
Technology $
Business
Management
Dilution
of Impact
Dilution
of Impact
Dilution
of Impact
IT
Management
Time
Source: P. Weill & M. Broadbent “Leveraging the New Infrastructure:
How market leaders capitalize on IT,” Harvard Business School
Press,
June 1998.
© 2004 Microsoft Corporation. All rights reserved.
BV
= business value
Center for Information Systems Research
Context
Need: Resilience,
Flexibility, Opportunism
Business
Strategy
Focus:
“Processized”
Analysis –
Vocabulary
Metrics
Business
Processes
Drivers: People,
Process, Information,
Relationships
IT
Strategy
Focus:
Governance
Portfolio
Architecture
Sourcing
Approach:
Business
Capabilities
© 2004 Microsoft Corporation. All rights reserved.
IT Solutions
Cost/Value
Analysis
Agility and the Process of Change
Agility is “Optimal Sense and Response”
Sense:
Are you aware of significant
changes in your business environment?
Strategize:
Are you able to
effectively plan to respond to the
change?
Decide:
Can you commit to
the plans?
Communicate:
Are you able to
get the word out to everyone who
needs to know?
Act:
Are you able to follow through
as efficiently as you can?
© 2004 Microsoft Corporation. All rights reserved.
The AQ Analysis
What does your
company do that
needs to be agile?
What can you
do to improve
your agility?
Business Drivers
Agility Enablers
People
Processes
Relationships
Awareness
Flexibility
Productivity
What key
technologies
can help?
Key Agility technologies
Those you have
Those you need
Information
Recommendation
Prioritized
Initiatives
© 2004 Microsoft Corporation. All rights reserved.
Prioritization
Assessment & Gap
Analysis
Top Issues
Current vs. Desired State
Overall
You vs. Industry
AQ Executive Summary
CUSTOMER wants to be sense environmental changes quickly and respond efficiently and effectively to those changes. It
wants to be agile not only to survive but to maintain its leadership in the industry.
Agility is the ability to sense, strategize, decide, communicate and act throughout the organization at the right time with the
right economics.
CUSTOMER does a fairly good job in strategizing and communicating with appropriate support from IT infrastructure and
services. The effectiveness of good strategy is tampered by lack of timely awareness and flexibility and speed in taking
actions.
Agility State
Sense A F
P W
A F
P W
Act
Strategize A F
P W
Actual
Desired
A F
P W
Communicate
Decide A F
P W
A: Awareness
F: Flexibility
P: Productivity
W: Willingness
Poor
Moderate
Good
Based on the response to the agility questionnaire and the
agility analysis tool developed by Gartner and Microsoft.
© 2004 Microsoft Corporation. All rights reserved.
Sense: Awareness is a prerequisite for sense and respond.
CUSTOMER must ensure that the right information is made available
to the right people at the right time.
Strategize: The organization is reasonably good at planning in
response to changes in the environment it can detect.
Decide: In order to evaluate and execute the plans, CUSTOMER needs
the flexibility of re-wiring processes and integrating information across
application and organizational boundaries.
Communicate: The organization has various communication channels
and culture to communicate information and decisions at all levels
and across groups.
Act: Due to limited flexibility to connect and consolidate information
and processes, business activities and people are not very efficient
and effective in executing strategies.
IT Environment
Firm-wide infrastructure and applications: standard (utility) desktop
and server infrastructure (email, office tools, directory, OS);
Collaboration (Web Ex, net meeting); SAP
Architecture and governance: Primarily application-based; Insufficient
architecture for application and data integration.
Recommendations
Enterprise Architecture: Develop set of principles and guidelines to
direct the process of acquiring, building, modifying, interfacing and
managing IT services and resources.
Role-based Information Dashboards: Provide consolidated view of
information and business processes for individual groups.
What is IT Governance?
Decision rights and accountability framework to encourage desirable
behavior in the use of IT
Who has decision rights and input to key IT decisions.
IT Principles—role for IT
IT Infrastructure—what is shared and put in first
IT Architecture—integration & compatibility
Business application needs—what is required
IT Investment & Prioritization—how much and when
What is desirable behavior in the enterprise.
Sharing, reuse, cost savings, innovation, growth
What mechanisms are used to implement governance.
E.g., IT council, process teams, architecture office, SLAs
How much business value.
Responsibilities, accountabilities, measurement and metrics
Source: Don’t Just Lead, Govern!: Empowering Effective Enterprise Use of Information
Technology, P. Weill & J. Ross, Harvard Business School Press: Boston, Forthcoming
© 2004 Microsoft Corporation. All rights reserved.
How do enterprises govern?
Decision Domain
IT Principles
Governance Archetype
Input
Decision
IT
Infrastructure
Strategies
Input
Decision
IT
Architecture
Business
Application
Needs
Input
Input
Decision
Decision
IT Investment
Input
Decision
Business
Monarchy
0
27
0
7
0
6
1
12
1
30
IT
Monarchy
1
18
10
59
20
73
0
8
0
9
Feudal
0
3
1
2
0
0
1
18
0
3
Federal
83
14
59
6
46
4
81
30
93
27
Duopoly
15
36
30
23
34
15
17
27
6
30
Anarchy
0
0
0
1
0
1
0
3
0
1
No Data
or Don’t
Know
1
2
0
2
0
1
0
2
0
0
Most
common
patterns
The numbers in
each cell are
percentages of
the 256
enterprises
studied in 23
countries. The
columns add to
100%.
©MIT Sloan Center for Information Systems Research 2002 – Weill This framework is adapted from Weill & Woodham's work originally published
and copyrighted by the MIT Sloan CISR as Working Paper No. 326, "Don't Just Lead, Govern: Implementing Effective IT Governance," April 2002.
© 2004 Microsoft Corporation. All rights reserved.
Rethinking IT as an Investment Portfolio
- asset class, risk and return, strategy
(Innovation)
(Major Change)
(Facilitation)
(High Value Added)
(Interact with customers)
Increased control
Better information
Better integration
Improved quality
Increased sales
Competitive advantage
Competitive necessity
Market positioning
INFORMATIONAL STRATEGIC
Cut costs
Increase throughput
TRANSACTIONAL
INFRASTRUCTURE
( ) = public sector
Source: Weill & Broadbent “Leveraging the New Infrastructure: How
market leaders capitalize on IT,” Harvard Business School Press, 1998.
© 2004 Microsoft Corporation. All rights reserved.
Business integration
Business flexibility
Reduced marginal
cost of BU’s IT
Reduced IT costs
Standardization
© 1994-2003 Weill
Center for Information Systems Research
IT Portfolios In Different Industries
Information
(15)
Strategic
(5)
Transactional (40)
Infrastructure (40)
No. of
firms
Finance,
Insurance1
7
Nonmetal
Manufacturing,
Utilities,
Construction
19
3.5
5.2
Firm-wide $IT as a Percent
of Net Sales
Metal Manufacturing
86
Wholesale
Retail,
Transport
21
Information
&
Services5
14
All
147
1.4
2.3
1.3
2.0
2.1
1.7
2.6
1.4
2.0
2.5
(Three year averages)
Firm-wide $IT as a Percent
of Discretionary Expense3
(Three year averages)
12%
IT Investment 2001/02
IT Investment 1993–97
20% 18%
11% 17%
17%
26%
11% 20%
13%
14%
15%
11%
14%
18%
13%
54%
54%
56%
52%
45%
54%
13%
13% 22% 15 14% 22%
14%
16%
14%
4
(54 businesses over 5 years)
1 Net
13%
12%
12%
13%
61%
52%
52%
57%
Sales = Interest Income plus Fees
Expenses = Net Sales – (Net Sales * Net Margin)
3 Discretionary Expenses = Net Sales – (Net Sales * Operating
Margin before Depreciation)
2 Total
NSF Grant Number IIS-0085725
© 2004 Microsoft Corporation. All rights reserved.
13% 22%
4 Source:
Leveraging the New Infrastructure: How Market Leaders Capitalize on
Information Technology, Peter Weill & Marianne Broadbent, HBS Press, 1988.
5 Services include Professional, Scientific and Technical Services, Heath Care
Services, Social Assistance, Accommodation and Food Services
Center for Information Systems Research
Synchronize Information
Technology Portfolios to Strategy
Business Strategy
Average Firm
IT Portfolio
Mix of
Investments
$IT compared to
industry avg. as %
of expenses or
revenues
20%
Cost Focus
13%
20%
13%
13%
Balance Cost &
Agility
14%
17%
5%
54%
40%
42%
15%
50%
Average % of
Revenues &
Expenses
IT is 10-20%
lower than
industry average
IT is around
industry average
Source: P. Weill & M. Broadbent “Leveraging the New Infrastructure: How market leaders capitalize on
IT,” Harvard Business School Press, June 1998. (Based on a study of 54 businesses in 7 countries over
five years and 117 firms studied in 2001/02.)
© 2004 Microsoft Corporation. All rights reserved.
15%
Agility Focused
11%
58%
IT is 10-25%
higher than
industry average
Center for Information Systems Research
© 2004 Microsoft Corporation. All rights reserved.
Value Tools
Total Value of Opportunity
Measures both costs and benefits
Standard business measures
TCO Analyst
Focus = cost
Reference database
REJ (Rapid Economic Justification)
Alignment, Quantification, Accountability
Framework independent of tools
© 2004 Microsoft Corporation. All rights reserved.
Business Value Inventory
Study
Focus
Deliverable
Duration
Business Value
Total Cost Cost
Microsoft REJ
BDM Relationship Building
Cost/Benefit Analysis
ROI Analysis
Business Case
4 to 6 Weeks
Gartner TVO
Cost/Benefit Analysis
ROI Analysis
Gartner Credibility
Business Case
2 to 4 Weeks
Microsoft RPA
BDM Relationship Building
Application Portfolio Analysis
Microsoft/Customer Action Items
Customer/MS Account Plan
2 Weeks
Microsoft AQ
BDM/TDM Relationship Building
IT Alignment to Business Agility Gaps
Uses Gartner IT Agility Impact Model
Prioritized Technology Initiatives
Sustained xDM Engagement
2 Days
Navigant Office Value
Industry and process orientation
Value analysis (productivity focused)
ROI Analysis
Vertically-aligned business case
focused on KW productivity
1-2 Days
Microsoft BVA
Product Feature Mapping
Cost/Benefit Analysis
ROI Analysis
Collateral for Business Case
1 Day
Gartner TCO Analyst
Limited to Infrastructure
ROI Analysis
Gartner Credibility
Cost Analysis Document
1 Week
3rd Party TCO Tools
High Level TCO Estimate
Product Specific TCO
ROI Analysis
Limited Cost Analysis Document
2 Hours
NerveWire Deployment
Cost Tool
Desktop Deployment Costs
For MS, Partners & Customers
Predictive Modeling from RDP Data
Deployment Cost Estimate
1 Hour
© 2004 Microsoft Corporation. All rights reserved.
Assessment Spectrum
Value Oriented
AQ
Strategy
Office System
BV Model
1 day - 1 week
Simple/Fast
ROI (VS03)
Calculator
BVA
1 day
TVO
2-4 weeks
Mini – REJ
4-6 weeks
REJ
8 – 12 weeks
30min - 1 hour
Deployment
Cost Tool
1-2 hours
Comprehensive/Long
BV Consultants required
TCO Analyst
TCO Manager
1-2 weeks
4-8 weeks
Cost Oriented
© 2004 Microsoft Corporation. All rights reserved.
FedEx “Smart Tags” for MS Office XP
© 2004 Microsoft Corporation. All rights reserved.
Level and Effectiveness
of Senior Management in Governance
More senior management is better…
Rank/(Scale) of Effectiveness
When Involved*
1.
2.
3.
4.
5.
6.
CEO (4.4)
COO (3.0)
Business Unit Leader (2.7)
Business Unit CIO (1.7)
CFO (1.5)
CIO (1)
CIO must be involved for effectiveness
* Statistically significant relationship with governance performance – scale estimated by strength of coefficient.
© 2002 MIT Sloan Center for Information Systems Research (Weill).
© 2004 Microsoft Corporation. All rights reserved.
© 2004 Microsoft Corporation. All rights reserved.
This presentation is for informational purposes only. Microsoft makes no warranties, express or implied, in this summary.

