Study Guides, Chapters 9, 12, 13
advertisement

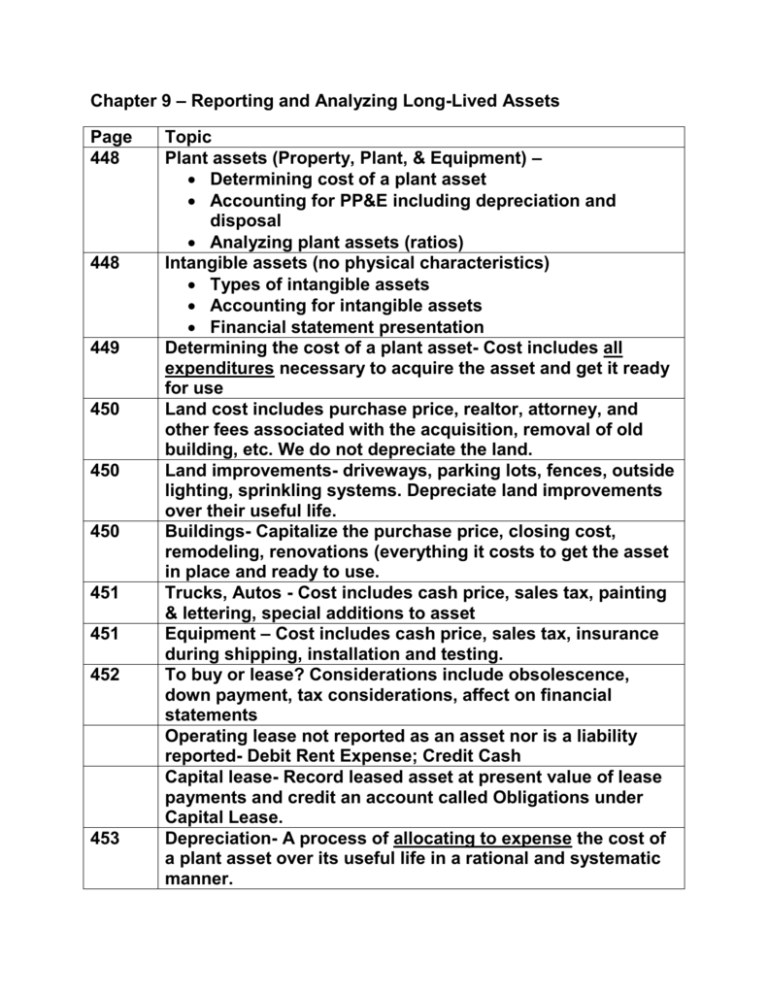
Chapter 9 – Reporting and Analyzing Long-Lived Assets Page 448 448 449 450 450 450 451 451 452 453 Topic Plant assets (Property, Plant, & Equipment) – Determining cost of a plant asset Accounting for PP&E including depreciation and disposal Analyzing plant assets (ratios) Intangible assets (no physical characteristics) Types of intangible assets Accounting for intangible assets Financial statement presentation Determining the cost of a plant asset- Cost includes all expenditures necessary to acquire the asset and get it ready for use Land cost includes purchase price, realtor, attorney, and other fees associated with the acquisition, removal of old building, etc. We do not depreciate the land. Land improvements- driveways, parking lots, fences, outside lighting, sprinkling systems. Depreciate land improvements over their useful life. Buildings- Capitalize the purchase price, closing cost, remodeling, renovations (everything it costs to get the asset in place and ready to use. Trucks, Autos - Cost includes cash price, sales tax, painting & lettering, special additions to asset Equipment – Cost includes cash price, sales tax, insurance during shipping, installation and testing. To buy or lease? Considerations include obsolescence, down payment, tax considerations, affect on financial statements Operating lease not reported as an asset nor is a liability reported- Debit Rent Expense; Credit Cash Capital lease- Record leased asset at present value of lease payments and credit an account called Obligations under Capital Lease. Depreciation- A process of allocating to expense the cost of a plant asset over its useful life in a rational and systematic manner. 454 455 455 456 457 458 458 462 463 Depreciation is a cost allocation process, not an asset valuation process (i.e., emphasis on getting a good matching on the income statement rather than a proper value for the asset on the balance sheet. Factors needed to compute depreciation: 1. Cost – As discussed on pages 436-437 2. Estimated Useful life – not physical life 3. Salvage Value (aka, scrap value, residual value) Pie chart indicates that straight-line method is used 83% of the time. Straight-line = (Cost – Salvage) / Estimated useful life Look at Depreciation schedule (Illustration 9-9) Double Declining-Balance = (Cost – Accumulated Depreciation) x Twice the Straight-line Rate See Appendix, page 461 for illustration. You are responsible for this! Straight-line rate for a five year life is 1/5, so we’ll use a rate of 2/5 for the Double Declining-Balance method Look at Depreciation schedule (Illustration 9-10) Units-of-Activity = (Cost – Salvage) / Estimated units in life. Look at Depreciation schedule (Illustration 9-11) See Appendix, page 476 for illustration. You are responsible for this! Illustration 9-12- Comparison of methods. Notice that total depreciation is the same over the five year life. What differs is that SL writes asset off evenly, DDB writes a large amount of the asset off in the early years Unit-of-activity methods depreciation differs due to usage (physical wear and tear) Repair Expense increases as asset ages, so total depreciation under DDB + repair expense might be similar over the years of the asset use For tax purposes, taxpayers must choose between straightline and Modified Accelerated Cost Recovery System (MACRS). But this isn’t tax class! Disposal of plant asset – scrap, sell, or trade-in Notice journal entries to record depreciation and sale of asset: Record cash received, eliminate Accumulated 464 465 466 466 462 468 468 476 500 Depreciation account, eliminate asset account, and show balance as a gain or loss. If the cash received is greater than the asset’s book value, you have a gain (credit Gain on Sale). If the cash received is less than the asset’s book value, you have a loss (debit Loss on Sale) Analyzing Plant Assets Return on Assets (ROA) = Net Income / Average Total Assets Asset Turnover Ratio = Net Sales / Average Total Assets Profit Margin Ratio = Net Income / Net Sales ROA = Profit Margin Ratio x Asset Turnover Ratio Accounting for Intangible Assets – Patents, Copyrights, Franchises, Trademarks, Trade Names, Goodwill, Research and Development costs. Amortization is the process of writing off an intangible asset. We depreciate tangible assets and amortize intangibles. Goodwill is capitalized but not amortized (subject to an annual impairment test) R & D is expensed and never capitalized Compute amortization on a patent- straight-line method used. International Accounting Standards differ from US GAAP Research is expensed but Development is capitalized. Appendix 9A. Other Depreciation Methods Double Declining Balance- Illustration 9A-2 Unit of Activity- Illustration 9A-4 A Look at IFRS (Property, Plant, and Equipment) Chapter 12 – Statement of Cash Flows Page 624 625 627 628 630 629-630 638 Topic We briefly looked at the Statement of Cash Flows in Basic Training and in Chapter 1. We know the three sections: Cash from Operating Activities, Financing Activities, and Investing Activities. We know that we are looking at sources and uses of CASH. This statement is necessary because the other three statements use accrual accounting and don’t necessarily stress cash. By looking at comparative Balance Sheets, we can see the beginning and ending cash for the current year, but can’t explain the changes to cash. Usefulness of Statement of Cash Flows: Company’s ability to generate future cash (usefulness in valuation models in Finance) Company’s ability to pay debt and dividends Opportunity to evaluate differences between net income and cash from operating activities Concise list of cash investing activities and financing activities Noncash financing and investing activities: Issuance of stock for assets Issuance of long-term debt for assets Conversion of long-term debt for stock Exchange of plant assets (e.g., land for building) Format of the Statement of Cash Flows Corporate and Product Life Cycle- Introductory, Growth, Maturity, and Decline. A Statement of Cash Flows can provide insight as to the stage of a company’s life cycle. Usage of Methods – 99% use the indirect method Information needed to prepare statement the statement of cash flows– Comparative Balance Sheets, Income Statement, Other Information STATEMENT OF CASH FLOWS Cash from Operating Activities Start with Net Income Assign Sheet 670 639 642 643 652 680 Make conversions needed to change from accrual basis to cash basis. This statement follows the Indirect Method. Cash from Investing Activities Purchase and Sale of Long-term Assets (Investments and PP&E) Cash from Financing Activities Changes in Common Stock, Preferred Stock, Dividends, LT Debt, Bonds Payable Combine OA, IA, and FA to determine change in cash for period Add Cash at beginning of period to change in cash to get Cash at end of period. Report Noncash Investing and Financing Activities Examine the Study Aid provided on the Assignment Sheet Complete P12-9A (Lemere Corp.) together in class Ratios: Free Cash Flow = Cash from Operating ActivitiesCapital Expenditures – Cash Dividends Current Cash Debt Coverage Ratio – Cash from Operations / Average Current Liabilities A measure of liquidity Cash Debt Coverage Ratio – Cash from Operations / Average Total Liabilities A measure of Solvency Statement of Cash Flows – Direct Method You are not responsible for the Direct Method but look at it to see similarities and differences with Indirect Method A Look at IFRS (Statement of Cash Flows) Chapter 13 – Financial Analysis: The Big Picture Page 686 687 687 689 690 690 692 693 695 695 697 698 699 700 700 701703 Topic Sustainable Income- most likely level of income to be obtained. That is, income before discontinued operations, extraordinary items, and other comprehensive income (all net of tax). Discontinued operations-division, product line Extraordinary items- event that is unusual and infrequent such as a flood or fire, expropriation (takeover) be foreign government, condemnation Ordinary items- natural casualty, not uncommon in area, write down of inventory, loss due to labor strike, sale of PPE Changes in Accounting Principle (Inventory, depreciation)For consistency, apply new principle to current and prior period. Comprehensive income- Gains and losses that are reported in stockholders’ equity rather than on the income statement such as gain or loss on sale of available-for-sale securities. Report on Income Statement after Net Income. Illustration 13-7- Complete Income Statement including irregular items. Comparative Analysis- intracompany (compare current to prior year), intercompany (compare to competition), industry averages. Horizontal analysis of Chicago Cereal 08 & 09 Balance Sheets Horizontal analysis of Chicago Cereal 08 & 09 Income Statements Vertical analysis of Chicago Cereal 08 & 09 Balance Sheets Vertical analysis of Chicago Cereal 08 & 09 Income Statements Ratio Analysis- We’ve seen them in prior chapters Liquidity Ratios Solvency Ratios Profitability Ratios These ratios are reported on the inside of the back cover of your text. This page will be photocopied and included on your final exam so you don’t have to memorize the ratios for the 708 743 exam. Appendix 13A- Comprehensive Illustration of Chicago Cereal A Look at IFRS (Financial Analysis and Irregular Items)


