Newton's Second Law Physics Lab Experiment
advertisement
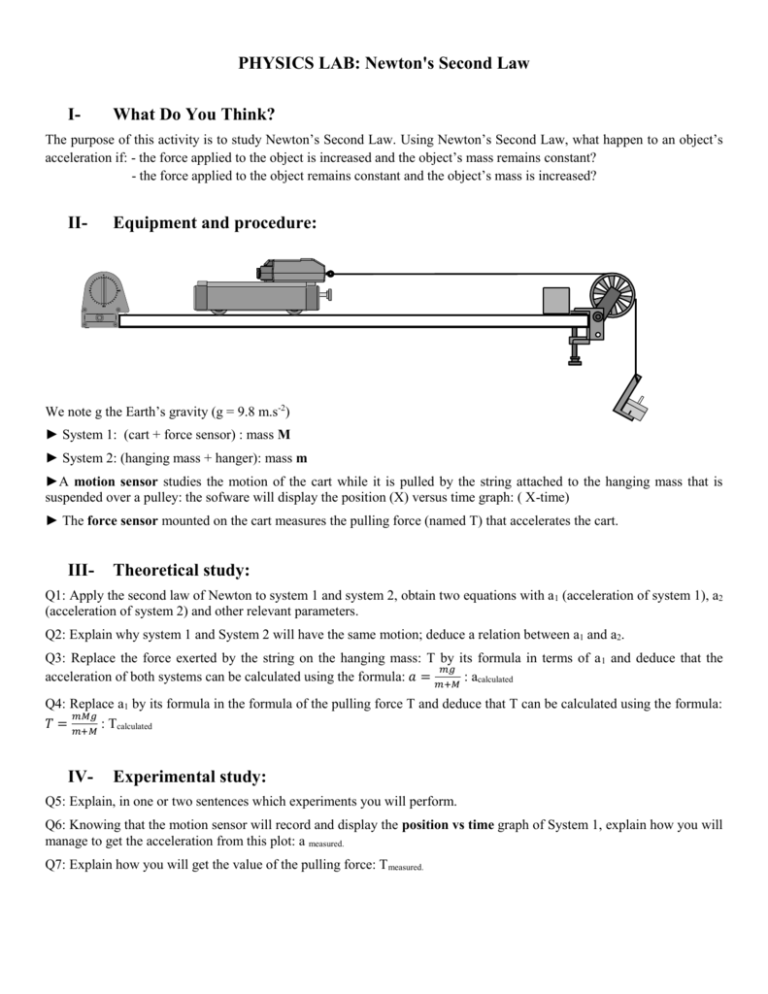
PHYSICS LAB: Newton's Second Law I- What Do You Think? The purpose of this activity is to study Newton’s Second Law. Using Newton’s Second Law, what happen to an object’s acceleration if: - the force applied to the object is increased and the object’s mass remains constant? - the force applied to the object remains constant and the object’s mass is increased? II- Equipment and procedure: We note g the Earth’s gravity (g = 9.8 m.s-2) ► System 1: (cart + force sensor) : mass M ► System 2: (hanging mass + hanger): mass m ►A motion sensor studies the motion of the cart while it is pulled by the string attached to the hanging mass that is suspended over a pulley: the sofware will display the position (X) versus time graph: ( X-time) ► The force sensor mounted on the cart measures the pulling force (named T) that accelerates the cart. III- Theoretical study: Q1: Apply the second law of Newton to system 1 and system 2, obtain two equations with a 1 (acceleration of system 1), a2 (acceleration of system 2) and other relevant parameters. Q2: Explain why system 1 and System 2 will have the same motion; deduce a relation between a1 and a2. Q3: Replace the force exerted by the string on the hanging mass: T by its formula in terms of a 1 and deduce that the 𝑚𝑔 acceleration of both systems can be calculated using the formula: 𝑎 = 𝑚+𝑀 : acalculated Q4: Replace a1 by its formula in the formula of the pulling force T and deduce that T can be calculated using the formula: 𝑚𝑀𝑔 𝑇 = 𝑚+𝑀 : Tcalculated IV- Experimental study: Q5: Explain, in one or two sentences which experiments you will perform. Q6: Knowing that the motion sensor will record and display the position vs time graph of System 1, explain how you will manage to get the acceleration from this plot: a measured. Q7: Explain how you will get the value of the pulling force: T measured. E8: Procedure 1. Set up the experiment using the previous drawing of the situation. 2. Connect motion sensor to PASCport1, force sensor to PASCport2 Interface 3. Open PASCO Capstone software then select: - Hardware set up: check that the system is active, click again to have the window vanishing - Graph: Click and drag the graph icon (from right side vertical menu) , select the plots that will be displayed: (Xtime) and (Force-time) by clicking on the Y axis (measurement) and selecting the right option. Note: ► Before starting to record every run, you have to release the tension applied on the force sensor’s hook and at the same time, press the tare button to calibrate the Force Sensor. ► Make sure the cart does not collide with the pulley (stop it), when ready, press RECORD 4. Analyzing the data: - Click on the (X-time) graph to make it active, highlight: analyse. Result: the area will be highlighted. the region of the (X-time) graph that you want to - Click the “Fit” menu button - Click on the (Force-time) graph, highlight the data you want to work with, click on the Statistic button select “mean value” and record the value in the data table. , select the right fit and record the equation found in the data table. , Table : Data collected during the experience and theoretical values for acceleration (a) and force (T) Item Run1 Run2 Run 3 Run 4 Run 5 M (g) m (g) Run 6 +200 25 (20+5) 25 50 (20+5+20+5) 50 50 +200 50 X(t) equation ameasured Tmeasured acalculated Tcalculated Q9: For the measured value of acceleration, give one example of your calculation and then display your results in the table. Q10: For the calculated values, give one sample of your calculation, and then display your results in the table . V- Analysis, conclusion. Q11: Describe the (X-time) graphs, relate them to the motion of the cart. Q12: Is the Newton’s law checked? Q13: How does the acceleration vary if the force applied to the cart increases? If the mass of the cart increases? Back up your answer with your experimental results. Q14: Error analysis: calculate the percentage difference between the measured and the calculated values and comment.
