Measuring Motion Objective: To understand the relationship
advertisement
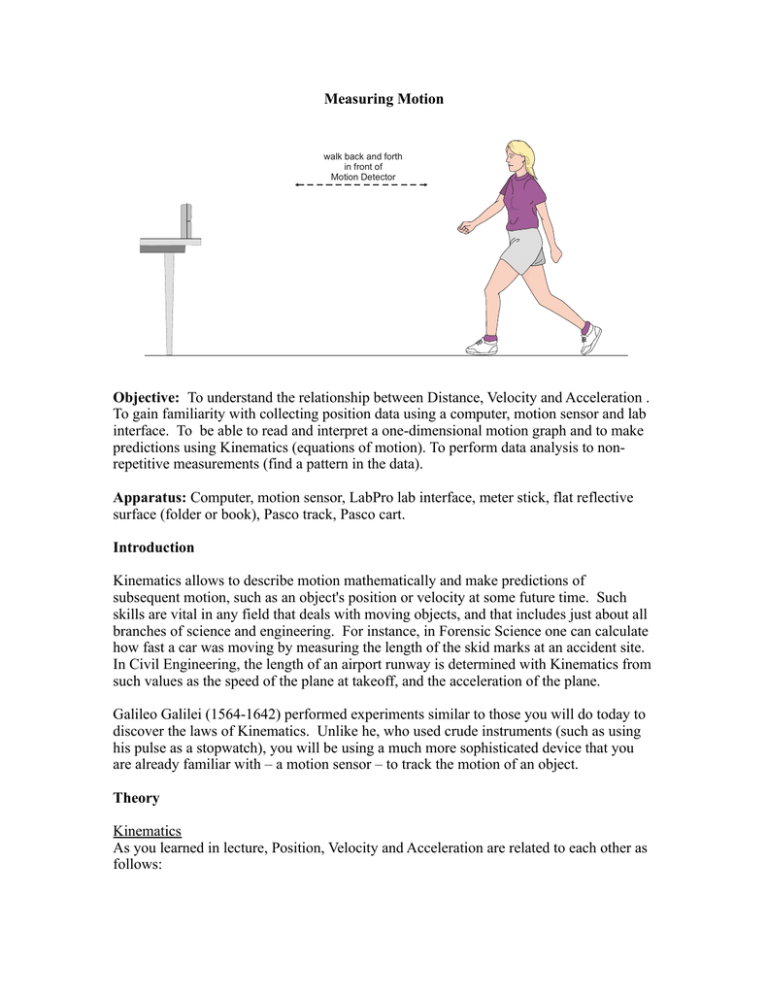
Measuring Motion walk back and forth in front of Motion Detector Objective: To understand the relationship between Distance, Velocity and Acceleration . To gain familiarity with collecting position data using a computer, motion sensor and lab interface. To be able to read and interpret a one-dimensional motion graph and to make predictions using Kinematics (equations of motion). To perform data analysis to nonrepetitive measurements (find a pattern in the data). Apparatus: Computer, motion sensor, LabPro lab interface, meter stick, flat reflective surface (folder or book), Pasco track, Pasco cart. Introduction Kinematics allows to describe motion mathematically and make predictions of subsequent motion, such as an object's position or velocity at some future time. Such skills are vital in any field that deals with moving objects, and that includes just about all branches of science and engineering. For instance, in Forensic Science one can calculate how fast a car was moving by measuring the length of the skid marks at an accident site. In Civil Engineering, the length of an airport runway is determined with Kinematics from such values as the speed of the plane at takeoff, and the acceleration of the plane. Galileo Galilei (1564-1642) performed experiments similar to those you will do today to discover the laws of Kinematics. Unlike he, who used crude instruments (such as using his pulse as a stopwatch), you will be using a much more sophisticated device that you are already familiar with – a motion sensor – to track the motion of an object. Theory Kinematics As you learned in lecture, Position, Velocity and Acceleration are related to each other as follows: 1. Position (x) is the the location of an object. In this experiment, this is the information that the motion sensor reports, as a function of time. 2. Distance vs. Displacement: Distance (always positive) is a scalar quantity that represents the length of travel. In one dimension, Displacement is the change in position x= x f − x i , and can be both positive or negative. The following shows the distinction between both: A student who starts at the upper left-hand corner of the rectangle on the left walks 4m East, 2m South, 4m West, then 2m North back to her starting location. Although her Displacement is 0m during her trip, her trip Distance is 12m. 3. Average velocity is the change in displacement divided by change in time v= x . t The slope between any two points in the x vs. t plot is the average velocity during those two points. 4. Average acceleration is the change in velocity divided by change in time a= v . t The slope between any two points in the v vs. t plot is the average acceleration between those two points. In the limit where the time interval between two points goes to zero t 0 , the above quantities become instantaneous velocity and acceleration and can be written in dx dv a= derivative form: v= ; dt dt 5. The area under the v vs. t plot is the total distance traveled. In calculus, we say that the distance traveled is equal to the definite integral between any two points in the plot. In the first experiment, you (or the cart on the track) will be the object in motion. You will try to duplicate, by moving yourself or a cart back and forth in front of a motion sensor, various plots of Distance, Velocity and Acceleration versus time. These graphs will be automatically plotted in the data-acquisition software, Logger Pro. In the second experiment, you will analyze the position of a cart on a track using the same motion sensor. You may also recall from lecture the general equation of motion, when acceleration is 2 dx constant (which can be gotten from doing a definite integral of a= 2 , for you dt 1 2 students of calculus): x t =x 0v 0 t at ; a time-independent version of this is: 2 v 2 =v 202a x . Curve-Fitting This is the application of data analysis to quantities that change with time (as opposed to your reaction time, which should be clustered around an average value). Typically one value (dependent variable, Y) is plotted against another (independent variable, X). Then a relationship between the two is determined by drawing a line as close to the points as possible; mathematically, the line is drawn such that the total distance between the line to the points (also called a least-squares fit): In this lab you will use software (Logger Pro) which allows you to perform a curve-fit on your data with a variety of functions – linear, quadratic, polynomial, exponential, etc. Procedure: Motion Sensor Note that you have your choice here of using your body as the object, or the cart (on the track) as your object. 1. Open “Motion PRACTICE.XMBL”, which is a Logger Pro file in the same folder as this write-up (PC Desktop-->Course Folders-->205-->Measuring Motion). 2. Position the motion sensor near the side of the table – as close as possible to the edge, but far enough such that it still lands on the table in the event it tips over. Make sure that the sensor switch is set to the Wide setting. Point it in such a direction that you, the object it will be tracking, have a 4 meter “corridor” of space in which you will neither bump into adjacent tables or people nor encroach onto other lab groups' “corridors”. Discuss the placement of your “corridors” with adjacent groups. Alternatively, you can also choose to use the cart (rather than your body) as the object in motion – in this case, keep the motion sensor positioned on the track and pointed toward the cart; the sensor switch should be set to the Narrow setting. *SKIP TO STEP 7 IF YOU ALREADY PERFORMED THE “Intro. to Experiment” LAB LAST WEEK. 3. Play around with the apparatus and software. Still in Motion PRACTICE.XMBL, Press the Collect button in Logger Pro to collect data. You will hear rapid clicking, which is the sound of the pulses coming out of the motion sensor. Have your partner move back and forth in front of the motion sensor in a random fashion (or move the cart back and forth in a random fashion in front of the motion sensor). 4. After the 10 second collection period, examine your graphs. In the menu bar, go to Analyze-->Examine. Now activate any of the three graphs by clicking on it, then moving the cursor around to trace the plot – you should see the coordinates displayed on the top left hand corner of the graph, and they will change as you move around the plot. If you are not getting any data, make sure your motion sensor is plugged into the DIG/SONIC1 input on the LabPro (translucent aqua blue covered flat box). 5. Turn off the Examine feature, and again go to Analyze-->Tangent. Move your cursor around one of the plots again – this time it will draw a line tangent to whatever point on the plot your cursor is on, and display the slope. Turn off the Tangent feature. 6. Use the meter stick and a piece of chalk to mark off two points on the floor one meter apart (or just note two points one meter apart on the track). Make sure they lie in a straight line along your motion sensor beam line, within your “corridor”. Press Collect again, and have your partner move from one marked point to another, spending a few seconds in each location (or move the cart accordingly). Confirm from your graphs that the points are indeed one meter apart. If they are not, notify your instructor. If your motion sensor has a wide/narrow beam adjustment, you can switch to the narrow beam if you are getting too much interference or back to the wide beam if the sensor is not tracking you; experiment with what works best. 7. You should now be ready to try the distance and velocity matches. Open up the first match file (Motion A -Walk.XMBL or Motion A – Cart.XMBL). Examine the blue trace with your partner and note the starting values. Discuss your walking (or cart rolling) plan to duplicate the blue trace, keeping in mind the relationships between Distance, Velocity and Acceleration. Remember that the beam may bounce off any object along its “cone”, so keep track of the objects it may bee seeing. You may also find that holding a flat, rigid object (folder or binder, for example) in front of you may improve the beam's “tracking” of your position. Practice a few times, and print out (use Print Graph) one good graph per match for matches A, B, C & D (total of 4 per group). Attach to hand-in sheet and submit. Cart on Track 1. Take your motion sensor from the side of the lab table. Upon examining it, you will notice that below the head (gold grille) is a slot with metal “leaf springs”. Insert it into the end of the Pasco track that does not have the guard and make sure the head of the sensor is pointing horizontally (the angle reads zero on the side of the sensor). See to it that the track is horizontal by rolling the cart along it and checking that it's not more likely to roll in one direction more than the other – in that case “level” the track by turning the screws on the rubber feet either clockwise or counterclockwise so that it is. 2. Again open up PRACTICE.CMBL and start the data collection. Play around with the cart/track by pushing it back and forth along the track a few times and observing the graphs. If the graphs have abrupt jumps in them, check to see that the motion sensor is pointed correctly and the beam width set properly, or that there is nothing in the way between 3. After this practice, collect some data – press the Collect button and give the cart a push until it almost reaches the other end of the track (catch it before it falls off or hits the sensor). Look at your graph and note the points when you released the cart and when you caught it on the other side. How do you know that these points indeed correspond to these two events? What can you (Positive? Negative? Zero? Increasing? Decreasing?) say about the Position, Velocity and Acceleration of the cart between these two points? 4. Remove the cart from the track. Now incline the motion sensor end of the the track (so that the cart will always be travelling away from the sensor and will never crash into it) by putting a few blocks under the set of legs on that end. Note that there is no reason to remove the legs whatsoever – determining the angle of the track can be determined from measuring how much one set of legs is elevated and some trigonometry Again collect data by releasing the cart from high on the track, catching it low on the track and comment qualitatively about the Position, Velocity and Acceleration of the cart between the points of release and catching. You will do curve-fitting in the next step, so save your data in the Documents folder or do not quit Logger Pro. 5. Curve-fitting Still in Logger Pro, go to the Menu Bar-->Examine-->Curve Fit. You'll see a list of fitting functions in the General Equation window; choose one of these (Linear or Quadratic, for instance), click on Try Fit, and see how closely the curve fits your data points. Remember that you should only select the range of data points of interest, which may not be all the points; select on the graph on the left the region of interest – for instance, it makes no sense to fit the time in which you are just holding the cart before it rolls down the incline! Once you are satisfied a function (and it makes sense physically – you wouldn't expect an exponential y= Aebt function to fit the distance a falling object falls with time; this 1 2 should look more like y = g t ), take note of the fit coefficients – these are the 2 coefficients that provide the closest fit. accleration kinematic equation In the case of the highly useful constant1 2 x t =x 0v 0 t at , the fit coefficients from Logger 2 Pro would appear as 1 A= a , B=v0 , C= x0. Note that acceleration a in this 2 equation is the component of acceleration along the track, and not the total acceleration. Print out the graph by selecting Print Graph rather than Print, which prints out the unneeded data table and wastes paper and toner. x t =At 2 Bt C , where Assessment and Presentation (Hand-in Sheet/Lab Notebook) Print out your graph matches a (remember, use only Print Graph) and label with your name(s), section and date. Include your values for the distance measurement between the two points on the floor using both the meter stick and the motion sensor (if you didn't do the Intro to Experiment lab). Print out (Print Graph) your curve-fit graph, making sure the fit coefficients are displayed. What function did you use to fit your data? What do each of these fit coefficients represent? Why did the particular function you chose make sense physically? Questions 1. Which graph was the most difficult to match, and why? Explain why it is extremely difficult to match the pre-drawn graph exactly. 2. What is the experimental acceleration of the cart as it is rolling down the track? How does it compare to the theoretical acceleration that you calculate from the track angle? 3. Without looking at your Logger Pro data (just use variable a as the acceleration), calculate the distance traveled between the 0 th and 1st second, the 1st and 2nd second, the 3rd and 4th second, etc, assuming initial zero velocity. What is the basic mathematical relationship between the time interval and the distance traveled within that time interval? 4. If the cart could continue falling with this acceleration along an infinitely long inclined track, how far would it have traveled for 10 seconds? 100 seconds?
