p09 push pull cart.doc
advertisement

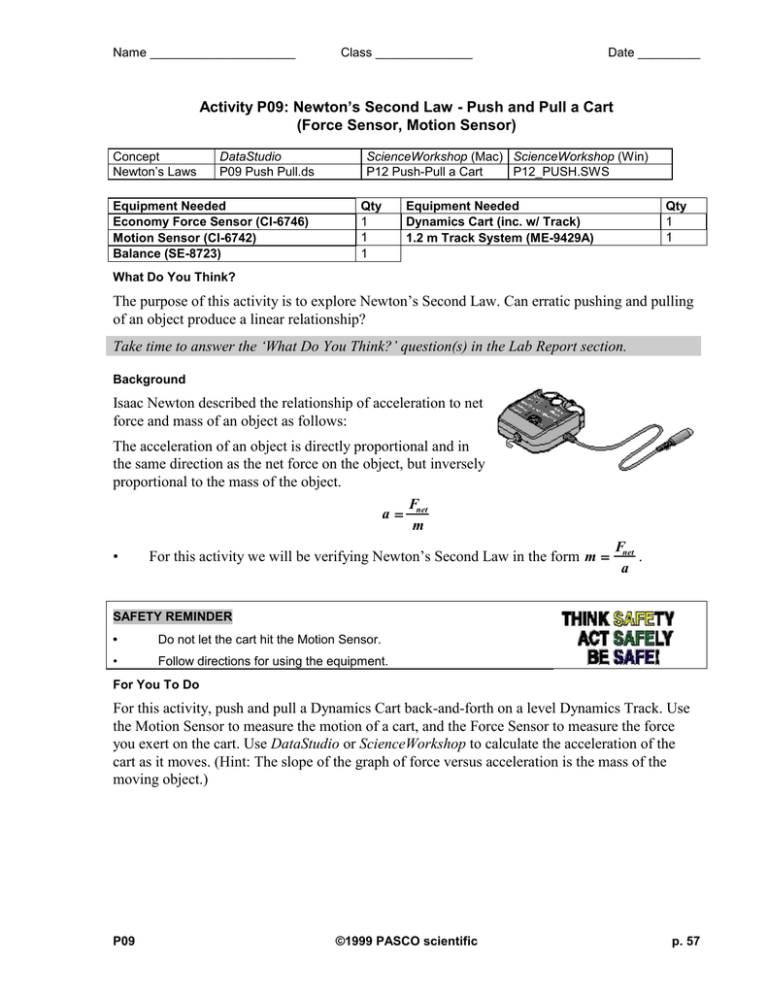
Name _____________________ Class ______________ Date _________ Activity P09: Newton’s Second Law - Push and Pull a Cart (Force Sensor, Motion Sensor) Concept Newton’s Laws DataStudio P09 Push Pull.ds Equipment Needed Economy Force Sensor (CI-6746) Motion Sensor (CI-6742) Balance (SE-8723) ScienceWorkshop (Mac) ScienceWorkshop (Win) P12 Push-Pull a Cart P12_PUSH.SWS Qty 1 1 1 Equipment Needed Dynamics Cart (inc. w/ Track) 1.2 m Track System (ME-9429A) Qty 1 1 What Do You Think? The purpose of this activity is to explore Newton’s Second Law. Can erratic pushing and pulling of an object produce a linear relationship? Take time to answer the ‘What Do You Think?’ question(s) in the Lab Report section. Background Isaac Newton described the relationship of acceleration to net force and mass of an object as follows: The acceleration of an object is directly proportional and in the same direction as the net force on the object, but inversely proportional to the mass of the object. F a net m • For this activity we will be verifying Newton’s Second Law in the form m Fnet . a SAFETY REMINDER • Do not let the cart hit the Motion Sensor. • Follow directions for using the equipment. For You To Do For this activity, push and pull a Dynamics Cart back-and-forth on a level Dynamics Track. Use the Motion Sensor to measure the motion of a cart, and the Force Sensor to measure the force you exert on the cart. Use DataStudio or ScienceWorkshop to calculate the acceleration of the cart as it moves. (Hint: The slope of the graph of force versus acceleration is the mass of the moving object.) P09 ©1999 PASCO scientific p. 57 Physics Labs with Computers, Vol. 1 P09: Newton’s Second Law - Push and Pull a Cart Student Workbook 012-07000A PART I: Computer Setup 1. Connect the ScienceWorkshop interface to the computer, turn on the interface, and turn on the computer. 2. Connect the Motion Sensor’s phone plugs to Digital Channels 1 and 2 on the interface. Plug the yellowbanded (pulse) plug into Digital Channel 1 and the second plug (echo) into Digital Channel 2. 3. Connect the DIN plug of the Force Sensor to Analog Channel A. 4. Open the document titled as shown: DataStudio P09 Push Pull.DS ScienceWorkshop (Mac) P12 Push-Pull a Cart ScienceWorkshop (Win) P12_PUSH.SWS • The DataStudio document has a Workbook display. Read the instructions in the Workbook. • The ScienceWorkshop document has a Graph display of Force versus Acceleration. • Data recording is set at 100 Hz for the Force Sensor and the Trigger Rate for the Motion Sensor is 20 times per second. • The calibration for the Force Sensor has been changed so that a push to the left is negative and a pull to the right is positive. PART II: Sensor Calibration and Equipment Setup • You do not need to calibrate the Motion Sensor. • To calibrate the Force Sensor, refer to the description in the introduction of this manual. 1. Place the track on a horizontal surface. Level the track by placing the cart on the track. If the cart rolls one way or the other, use the adjustable feet at one end of the track to raise or lower that end until the track is level and the cart does not roll one way or the other. 2. Mount the Force Sensor onto the accessory tray of the cart. 3. Measure and record the mass of the cart plus Force Sensor in the Data Table in the Lab Report section. 4. Position the Motion Sensor at the left end of the track. Place the cart on the track so the hook end of the Force Sensor points away from the Motion Sensor. The cart must remain a minimum distance away from the sensor (15 cm for the Motion Sensor II). Put a mark on the track at the minimum distance from the Motion Sensor (15 cm). p. 58 ©1999 PASCO scientific P09 Name _____________________ P09 Class ______________ ©1999 PASCO scientific Date _________ p. 59 Physics Labs with Computers, Vol. 1 P09: Newton’s Second Law - Push and Pull a Cart Student Workbook 012-07000A Trial Run of Data 1. Before recording data for later analysis, record a trial run with the Motion Sensor to make sure it is aligned and can “see” the cart as it moves. 2. Place the cart on one end of the Dynamics Track. Press the tare button on the side of the Force Sensor to zero the Force Sensor. 3. Firmly grasp the hook of the Force Sensor and pull and push the Force Sensor to make the cart move back and forth. Make sure the cart does not come too close to the Motion Sensor. 4. Start recording data. 5. After about 10 seconds, stop recording data. 6. Adjust the position of the Motion Sensor if necessary. PART III: Data Recording 1. Prior to recording each data run, press the tare button on the side of the Force Sensor to zero the Force Sensor. 2. After the Force Sensor has been zeroed, begin pulling and pushing on the hook of the Force Sensor to make the cart move back and forth. 3. Start recording data. 4. Push and pull the cart back and forth four or five times, then stop the recording. • Run #1 will appear in the Data list. If the data points do not appear on the graph, check the alignment of the Motion Sensor and try again. Analyzing the Data 1. Click-and-draw a rectangle around the region of the force versus acceleration plot that shows the movement of the cart. Release the mouse button, and the area will be highlighted. 2. Select the Linear curve fit. • In DataStudio, click the ‘Fit’ menu button ( • In ScienceWorkshop click the ‘Statistics’ button to open the Statistics area on the right side ). Select ‘Linear’. of the Graph. In the Statistics area, click the Statistics Menu button ( Fit, Linear Fit’ from the Statistics Menu. 3. ). Select ‘Curve Record the slope of the linear fit in the Data Table in the Lab Report section. Record your results in the Lab Report section. p. 60 ©1999 PASCO scientific P09 Name _____________________ P09 Class ______________ ©1999 PASCO scientific Date _________ p. 61 Physics Labs with Computers, Vol. 1 P09: Newton’s Second Law - Push and Pull a Cart Student Workbook 012-07000A Lab Report - Activity P09: Newton’s Second Law - Push and Pull a Cart What Do You Think? Can erratic pushing and pulling of an object produce a linear relationship? Data Table Item Value Mass of cart and Force Sensor (measured) Mass of cart & Force Sensor (slope) Questions 1. What are the appropriate units for the slope of the force vs. acceleration plot? 2. Why does the slope of the force versus acceleration plot equal the object’s mass? 3. What is the percentage difference between the actual and experimental mass? Remember, percent difference 4. p. 62 theoretical actual 100% theoretical What are some possible reasons for any differences between the measured and calculated or theoretical values? ©1999 PASCO scientific P09 Name _____________________ P09 Class ______________ ©1999 PASCO scientific Date _________ p. 63


