Damon Lowery
advertisement
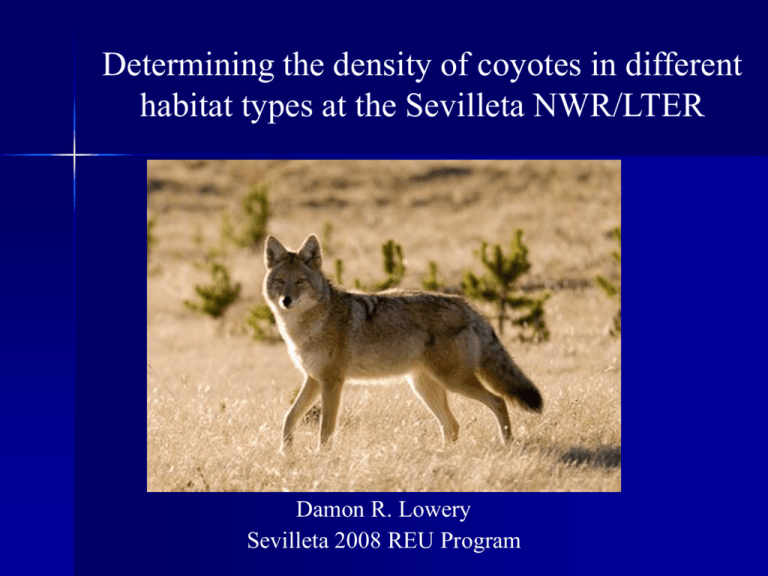
Determining the density of coyotes in different habitat types at the Sevilleta NWR/LTER Damon R. Lowery Sevilleta 2008 REU Program Coyote (Canis latrans) Medium-sized canids Various habitats throughout North and Central America Occupy dens or burrows Omnivorous diet Various hunting strategies NatureWorks. 2008 Project Objectives Estimate coyote densities at the Sevilleta NWR – Assess habitat use by coyotes Grassland, Shrubland, Woodland – Assess effect of percent woody vegetation cover on coyote densities Grassland Shrubland Woodland Context and Significance of Study Adds to past coyote research that has been performed at the Sevilleta NWR – Absolute density, Parmenter 2004 – Diet, Hernandez et al. 2002 Expands on the Parmenter (2004) data set Assist in management of land and top predators Research Question and Hypothesis Does the relative density of coyotes differ among habitat types or change with variation in percent woody vegetation cover? Coyote Relative Density – Hypothesis: Coyote densities will be higher in open, grassland habitats with less shrub and tree cover Coyote Relative Density G S W Habitat Type % Woody Cover Support for Hypothesis Open habitats = Higher coyote densities Potential reasons why – Coyotes evolved in open habitats – Open habitats contain a large abundance of preferred coyote prey species – Open habitats may be better suited to coyote hunting strategies Hidalgo-Mihart et al. 2006, Kamler and Gipson 2000 Study Site: Sevilleta NWR Scat Collection Methods Marked 13, one mile long road-based transects – 5 grassland – 5 shrubland – 3 woodland Collected scat weekly Identified scat (e.g. Halfpenny 2001) Scat Samples from Different Species 2.5 X 12cm scat. Large taper. Coyote 2.5 X 11cm scat. Coyote. 1 X 7cm scat. Ringtail. Berry filled scat. Species Unknown. 2.75 X 13cm scat. Black Bear. 2 X 7.5cm scat. Possibly Bobcat. Habitat Assessment Methods Determined habitat types – ArcGIS tools and Sevilleta vegetation map Determined percent woody vegetation cover – 100m line intercept transects Scat Data Scat from 8 known species and potentially ≥ 5 other species 289 total scats collected Species 78 coyote scats collected = 27% of all scats # of Scats Coyote 78 Kit, Gray, Red Fox 51 Habitat Type Ringtail Mountain Lion GrasslandBobcat # of Coyote Scats 27 Striped Skunk Spotted Skunk Shrubland Possibly ≥2 species 11 8 34.6% 5 35 Black Bear Unknown Woodland Percentage of All 13 Coyote Scats 3 44.9% 1 16 52 20.5% 67 Percent Woody Vegetation Cover for Each Scat Transect Initial assessment of habitat type for each scat transect confirmed by line intercept transects and ArcGIS analysis 24 total woody species Gutierrezia sarothrae (broom snakeweed) most common and abundant Habitat Type Avg. % Woody Cover Total # of Woody Species Grassland 3.41 % 9 Shrubland 19.22 % 15 Woodland 37.96 % 13 Relative Density Calculation Relative Density: – R = S/(LnD) (Webbon et al. 2004) R = relative density S = # of feces found when collecting Ln = length of linear features driven D = # of days between collections Densities for all transects within a given habitat type were averaged Coyote Densities for Each Habitat Type Habitat Type Average Density Grassland 0.129 Shrubland 0.167 Woodland 0.127 Statistical Analysis Differences in coyote density among different habitat types were assessed using an ANOVA Coyote Relative Density G S Habitat Type W Coyote Relative Density Results of ANOVA p = 0.88 0.18 0.16 0.14 0.12 0.1 0.08 0.06 0.04 0.02 0 Grassland Shrubland Habitat Type Woodland Statistical Analysis Performed a regression analysis on coyote densities vs. percent woody vegetation cover Coyote Relative Density % Woody Vegetation Cover Results of Regression Analysis Y= 0.0002x + 0.1398 R2 = 0.0004 p = 0.95 Coyote Relative Density 0.4 0.35 0.3 0.25 0.2 0.15 0.1 0.05 0 0 10 20 30 % Woody Vegetation Cover 40 50 Overview of Findings Shrubland habitat had the highest density of coyotes However, NO statistically significant differences in densities among habitats NO correlation between percent woody cover and density of coyotes Significance of Findings Open habitats ≠ higher coyote densities Amount of woody vegetation cover has NO effect on coyote densities Discussion of Findings Why were there no differences among habitats? – – – – Densities do NOT differ among habitats Prey in equal abundance in all habitat types Road location and usage Sample size: # of scat collections and transects Future Work DNA and dietary analysis of scats Further study of coyote habitat use Apply study results to management of coyotes and their prey species Acknowledgements I’d like to thank the following for their help and support: NSF and Sevilleta REU Program UNM and US Fish and Wildlife Service Virginia Seamster Jennifer Johnson John Dewitt Terri Koontz Kelly Bowman All of the Sevilleta REU’s and Interns, especially CJ Jewell, Dan Colman, and Emerson Tuttle Questions? Sevilleta 2008 REU Program References Halfpenny JC. 2001. Scats and Tracks of the Rocky Mountains. Guilford: The Globe Pequot Press. 144 p. Hernández L, Parmenter RR, Dewitt JW, Lightfoot DC, Laundré JW. 2002. Coyote diets in the Chihuahuan Desert, more evidence for optimal foraging. Journal of Arid Environments, 51: 613-624. Hidalgo-Mihart MG, Cantú-Salazar L, López-González CA, Martínez-Gutíerrez PG, Fernandez EC, and González-Romero A. 2006. Coyote habitat use in a tropical deciduous forest of Western Mexico. Journal of Wildlife Management, 70: 216-221. Kamler JF and Gipson PS. 2000. Space and habitat use by resident and transient coyotes. Canadian Journal of Zoology, 78: 2106-2111. NatureWorks. 2008. Coyote- Canis latrans. Available at http://www.nhptv.org/natureworks/coyote.htm Parmenter B. 2004. Coyote Scat Survey. Albuquerque, NM: Sevilleta Long Term Ecological Research Site Database: SEV049. http://sev.lternet.edu/project_details.php?id=SEV049. Accessed: May 8, 2008. Webbon CC, Baker PJ, and Harris S. 2004. Faecal counting for monitoring changes in red fox numbers in rural Britain. Journal of Applied Ecology, 41: 768-779.
