Development indicators
advertisement
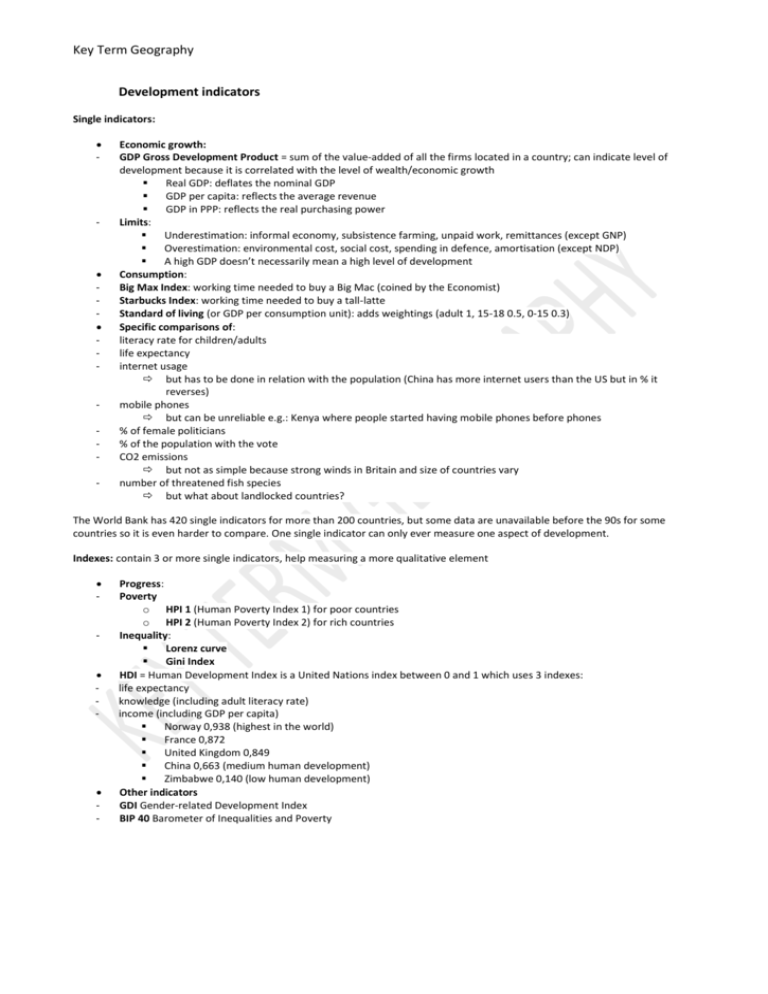
Key Term Geography Development indicators Single indicators: - - - Economic growth: GDP Gross Development Product = sum of the value-added of all the firms located in a country; can indicate level of development because it is correlated with the level of wealth/economic growth Real GDP: deflates the nominal GDP GDP per capita: reflects the average revenue GDP in PPP: reflects the real purchasing power Limits: Underestimation: informal economy, subsistence farming, unpaid work, remittances (except GNP) Overestimation: environmental cost, social cost, spending in defence, amortisation (except NDP) A high GDP doesn’t necessarily mean a high level of development Consumption: Big Max Index: working time needed to buy a Big Mac (coined by the Economist) Starbucks Index: working time needed to buy a tall-latte Standard of living (or GDP per consumption unit): adds weightings (adult 1, 15-18 0.5, 0-15 0.3) Specific comparisons of: literacy rate for children/adults life expectancy internet usage but has to be done in relation with the population (China has more internet users than the US but in % it reverses) mobile phones but can be unreliable e.g.: Kenya where people started having mobile phones before phones % of female politicians % of the population with the vote CO2 emissions but not as simple because strong winds in Britain and size of countries vary number of threatened fish species but what about landlocked countries? The World Bank has 420 single indicators for more than 200 countries, but some data are unavailable before the 90s for some countries so it is even harder to compare. One single indicator can only ever measure one aspect of development. Indexes: contain 3 or more single indicators, help measuring a more qualitative element - - Progress: Poverty o HPI 1 (Human Poverty Index 1) for poor countries o HPI 2 (Human Poverty Index 2) for rich countries Inequality: Lorenz curve Gini Index HDI = Human Development Index is a United Nations index between 0 and 1 which uses 3 indexes: life expectancy knowledge (including adult literacy rate) income (including GDP per capita) Norway 0,938 (highest in the world) France 0,872 United Kingdom 0,849 China 0,663 (medium human development) Zimbabwe 0,140 (low human development) Other indicators GDI Gender-related Development Index BIP 40 Barometer of Inequalities and Poverty

