Bales_2011allhands_poster
advertisement

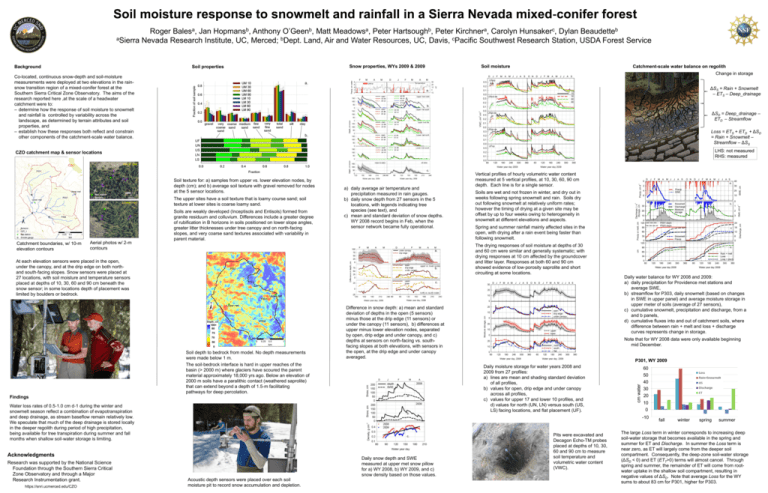
Soil moisture response to snowmelt and rainfall in a Sierra Nevada mixed‐conifer forest Roger Balesa, Jan Hopmansb, Anthony O’Geenb, Matt Meadowsa, Peter Hartsoughb, Peter Kirchnera, Carolyn Hunsakerc, Dylan Beaudetteb aSierra Nevada Research Institute, UC, Merced; bDept. Land, Air and Water Resources, UC, Davis, cPacific Southwest Research Station, USDA Forest Service Snow properties, WYs 2009 & 2009 Soil properties Background Co-located, continuous snow-depth and soil-moisture measurements were deployed at two elevations in the rainsnow transition region of a mixed-conifer forest at the Southern Sierra Critical Zone Observatory. The aims of the research reported here ,at the scale of a headwater catchment were to: – determine how the response of soil moisture to snowmelt and rainfall is controlled by variability across the landscape, as determined by terrain attributes and soil properties, and – establish how these responses both reflect and constrain other components of the catchment-scale water balance. Soil moisture D F M A M D J F M A J F M A M J Catchment-scale water balance on regolith J A S O N D J F M A M J J A Change in storage S M a. ΔSS = Rain + Snowmelt – ETS – Deep_drainage a. b. ΔSD = Deep_drainage – ETD – Streamflow Loss = ETS + ETD + ΔSD = Rain + Snowmelt – Streamflow – ΔSS b. UF UN US LN LS CZO catchment map & sensor locations LHS: not measured RHS: measured Upper met CZO c. Lower met Catchment boundaries, w/ 10-m elevation contours Aerial photos w/ 2-m contours The upper sites have a soil texture that is loamy course sand; soil texture at lower sites is coarse loamy sand. Soils are weakly developed (Inceptisols and Entisols) formed from granite residuum and colluvium. Differences include a greater degree of rubification in B horizons in soils positioned on lower slope angles, greater litter thicknesses under tree canopy and on north-facing slopes, and very coarse sand textures associated with variability in parent material. a) daily average air temperature and precipitation measured in rain gauges. b) daily snow depth from 27 sensors in the 5 locations, with legends indicating tree species (see text), and c) mean and standard deviation of snow depths. WY 2008 record begins in Feb, when the sensor network became fully operational. F M A M D J F M b. c. 100+ 80 75 70 50 0 Soil depth to bedrock from model. No depth measurements were made below 1 m. The soil‐bedrock interface is hard in upper reaches of the basin (> 2000 m) where glaciers have scoured the parent material approximately 18,000 yrs ago. Below an elevation of 2000 m soils have a paralithic contact (weathered saprolite) that can extend beyond a depth of 1.5‐m facilitating pathways for deep percolation. D J F M A Water loss rates of 0.5‐1.0 cm d‐1 during the winter and snowmelt season reflect a combination of evapotranspiration and deep drainage, as stream baseflow remain relatively low. We speculate that much of the deep drainage is stored locally in the deeper regolith during period of high precipitation, being available for tree transpiration during summer and fall months when shallow soil‐water storage is limiting. b. Acknowledgments Daily snow depth and SWE measured at upper met snow pillow for a) WY 2008, b) WY 2009, and c) snow density based on those values. Acoustic depth sensors were placed over each soil moisture pit to record snow accumulation and depletion. F M A M J J A S O N D J F M A M J J A S Spring and summer rainfall mainly affected sites in the open, with drying after a rain event being faster than following snowmelt. The drying responses of soil moisture at depths of 30 and 60 cm were similar and generally systematic; with drying responses at 10 cm affected by the groundcover and litter layer. Responses at both 60 and 90 cm showed evidence of low‐porosity saprolite and short circuiting at some locations. D J F M A M J J A S O N D J F M A M J J A S Daily water balance for WY 2008 and 2009: a) daily precipitation for Providence met stations and average SWE, b) streamflow for P303, daily snowmelt (based on changes in SWE in upper panel) and average moisture storage in upper meter of soils (average of 27 sensors), c) cumulative snowmelt, precipitation and discharge, from a and b panels, d) cumulative fluxes into and out of catchment soils, where difference between rain + melt and loss + discharge curves represents change in storage. Note that for WY 2008 data were only available beginning mid December. P301, WY 2009 Daily moisture storage for water years 2008 and 2009 from 27 profiles: a) lines are mean and shading standard deviation of all profiles, b) values for open, drip edge and under canopy across all profiles, c) values for upper 17 and lower 10 profiles, and d) values for north (UN, LN) versus south (US, LS) facing locations, and flat placement (UF). 60 50 40 30 20 10 0 -10 c. J Soils are wet and not frozen in winter, and dry out in weeks following spring snowmelt and rain. Soils dry out following snowmelt at relatively uniform rates; however the timing of drying at a given site may be offset by up to four weeks owing to heterogeneity in snowmelt at different elevations and aspects. Difference in snow depth: a) mean and standard deviation of depths in the open (5 sensors) minus those at the drip edge (11 sensors) or under the canopy (11 sensors), b) differences at upper minus lower elevation nodes, separated by open, drip edge and under canopy, and c) depths at sensors on north-facing vs. southfacing slopes at both elevations, with sensors in the open, at the drip edge and under canopy averaged. a. Findings https://snri.ucmerced.edu/CZO M a. At each elevation sensors were placed in the open, under the canopy, and at the drip edge on both north‐ and south‐facing slopes. Snow sensors were placed at 27 locations, with soil moisture and temperature sensors placed at depths of 10, 30, 60 and 90 cm beneath the snow sensor; in some locations depth of placement was limited by boulders or bedrock. Research was supported by the National Science Foundation through the Southern Sierra Critical Zone Observatory and through a Major Research Instrumentation grant. A D cm water Soil texture for: a) samples from upper vs. lower elevation nodes, by depth (cm); and b) average soil texture with gravel removed for nodes at the 5 sensor locations. Vertical profiles of hourly volumetric water content measured at 5 vertical profiles, at 10, 30, 60, 90 cm depth. Each line is for a single sensor. Pits were excavated and Decagon Echo-TM probes placed at depths of 10, 30, 60 and 90 cm to measure soil temperature and volumetric water content (VWC). fall winter spring summer The large Loss term in winter corresponds to increasing deep soil-water storage that becomes available in the spring and summer for ET and Discharge. In summer the Loss term is near zero, as ET will largely come from the deeper soil compartment. Consequently, the deep-zone soil-water storage (ΔSD < 0) and ET (ETT>0) terms will almost cancel. Through spring and summer, the remainder of ET will come from rootwater uptake in the shallow soil compartment, resulting in negative values of ΔSD. Note that average Loss for the WY sums to about 83 cm for P301, higher for P303.


